Why a consultancy wrote a history book
Every week someone on a project asks us a version of the same question. Who invented BIM? Sometimes it is a young modeller on their first federated model. Sometimes it is a client's director who has been told, in a tender document, that BIM was "coined in 1992 by a British architect". That sentence is wrong in two places at once, and it keeps getting copied.
We wrote this book because the true story is better than the myths, and because it is useful. Building Information Modeling did not arrive as a software release. It arrived as an argument, made by a handful of researchers more than fifty years ago, that a building should be described to a computer as things with properties rather than as lines on paper. It then took the construction industry about four decades, several generations of hardware, a few very unusual buildings and a number of governments to act on that argument.
Knowing that sequence changes how you work. It explains why the modelling problem was solved long ago while the information problem was not. It explains why open standards matter more than any single product. And it explains why ISO 19650, the standard that governs most of the work we do today, barely mentions software at all.
We are ConstruBIM, a BIM implementation and digital delivery consultancy. Our teams have worked inside some of the chapters described here: the federated model of the new Mexico City International Airport, the hexagonal skin of the Soumaya Museum, the governance of digital delivery at NEOM. We have tried not to let that make us the heroes of the story. The heroes are Ivan Sutherland, Charles Eastman, a group of engineers from Liverpool, a start-up in Budapest, two researchers in Delft, and thousands of people who spent their careers making models that other people could trust.
This book is free. Read it, print it, give it to your team, put it in a university reading list. If you find an error, tell us and we will fix it in the next edition.

September 2026
Prologue · Prologue · before 1960
The Paper Problem
For five hundred years, a building existed twice: once in the world, and once as a stack of drawings that were never quite sure they agreed with each other.
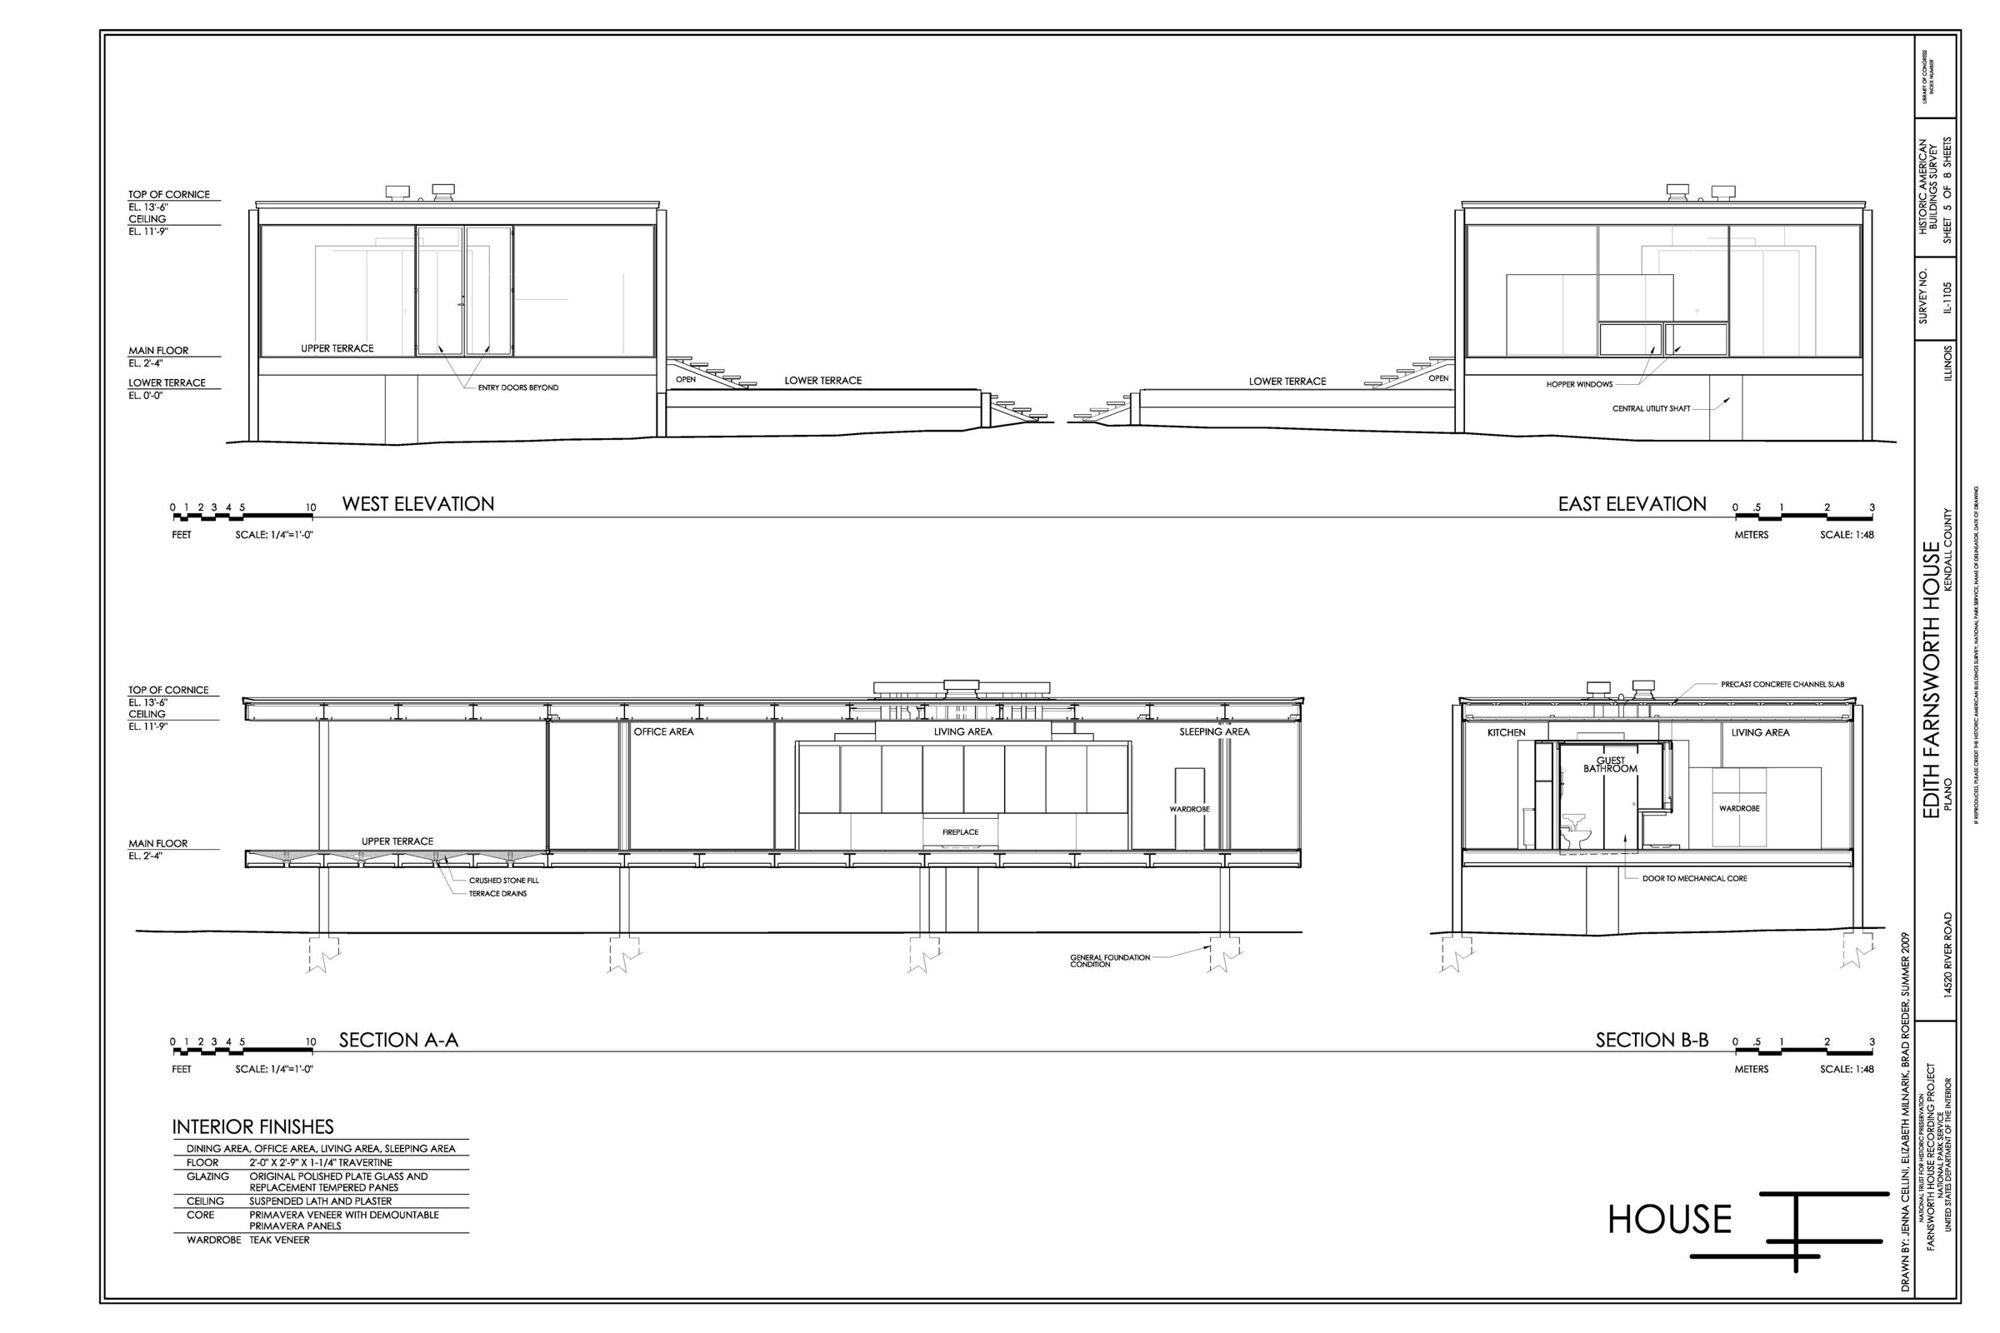
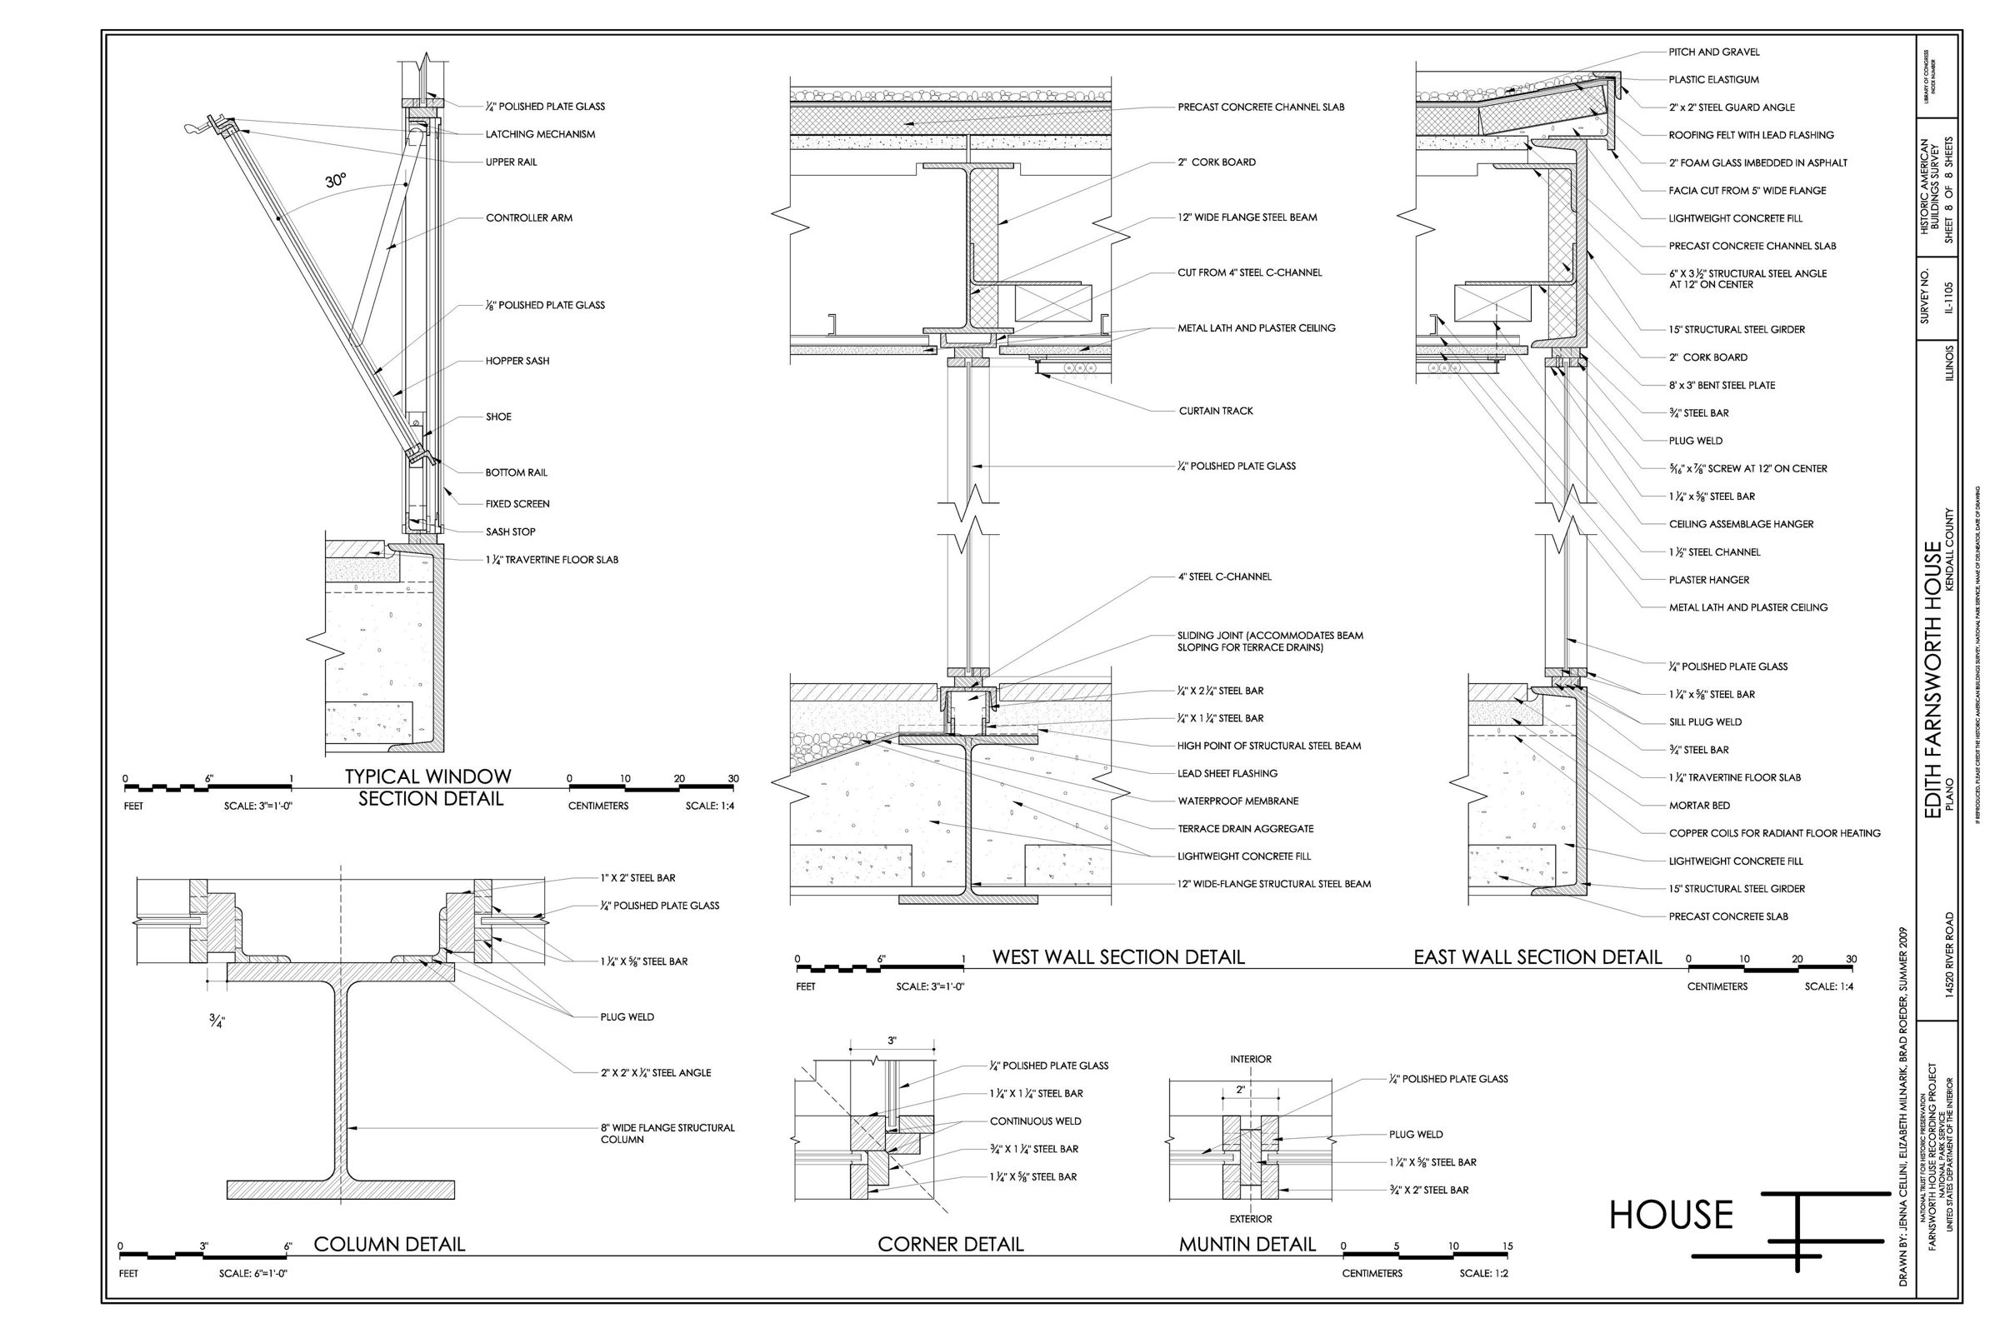
Imagine a door. On a traditional set of construction documents that single door appears in many places. It is drawn on the floor plan as a gap and a quarter circle. It appears again on an elevation, again on a section, again at a larger scale on a detail sheet, as a line in a door schedule, as a paragraph in a specification, and as a number in a cost plan. Each of those appearances was made by hand, usually by a different person, at a different time.
Now move the door thirty centimetres to the left. Every one of those representations has to change, and nothing forces them to. If a single sheet is missed, the drawings now describe two different buildings. Multiply that by the hundreds of thousands of elements in a hospital or an airport and you have the central problem that Building Information Modeling set out to solve.
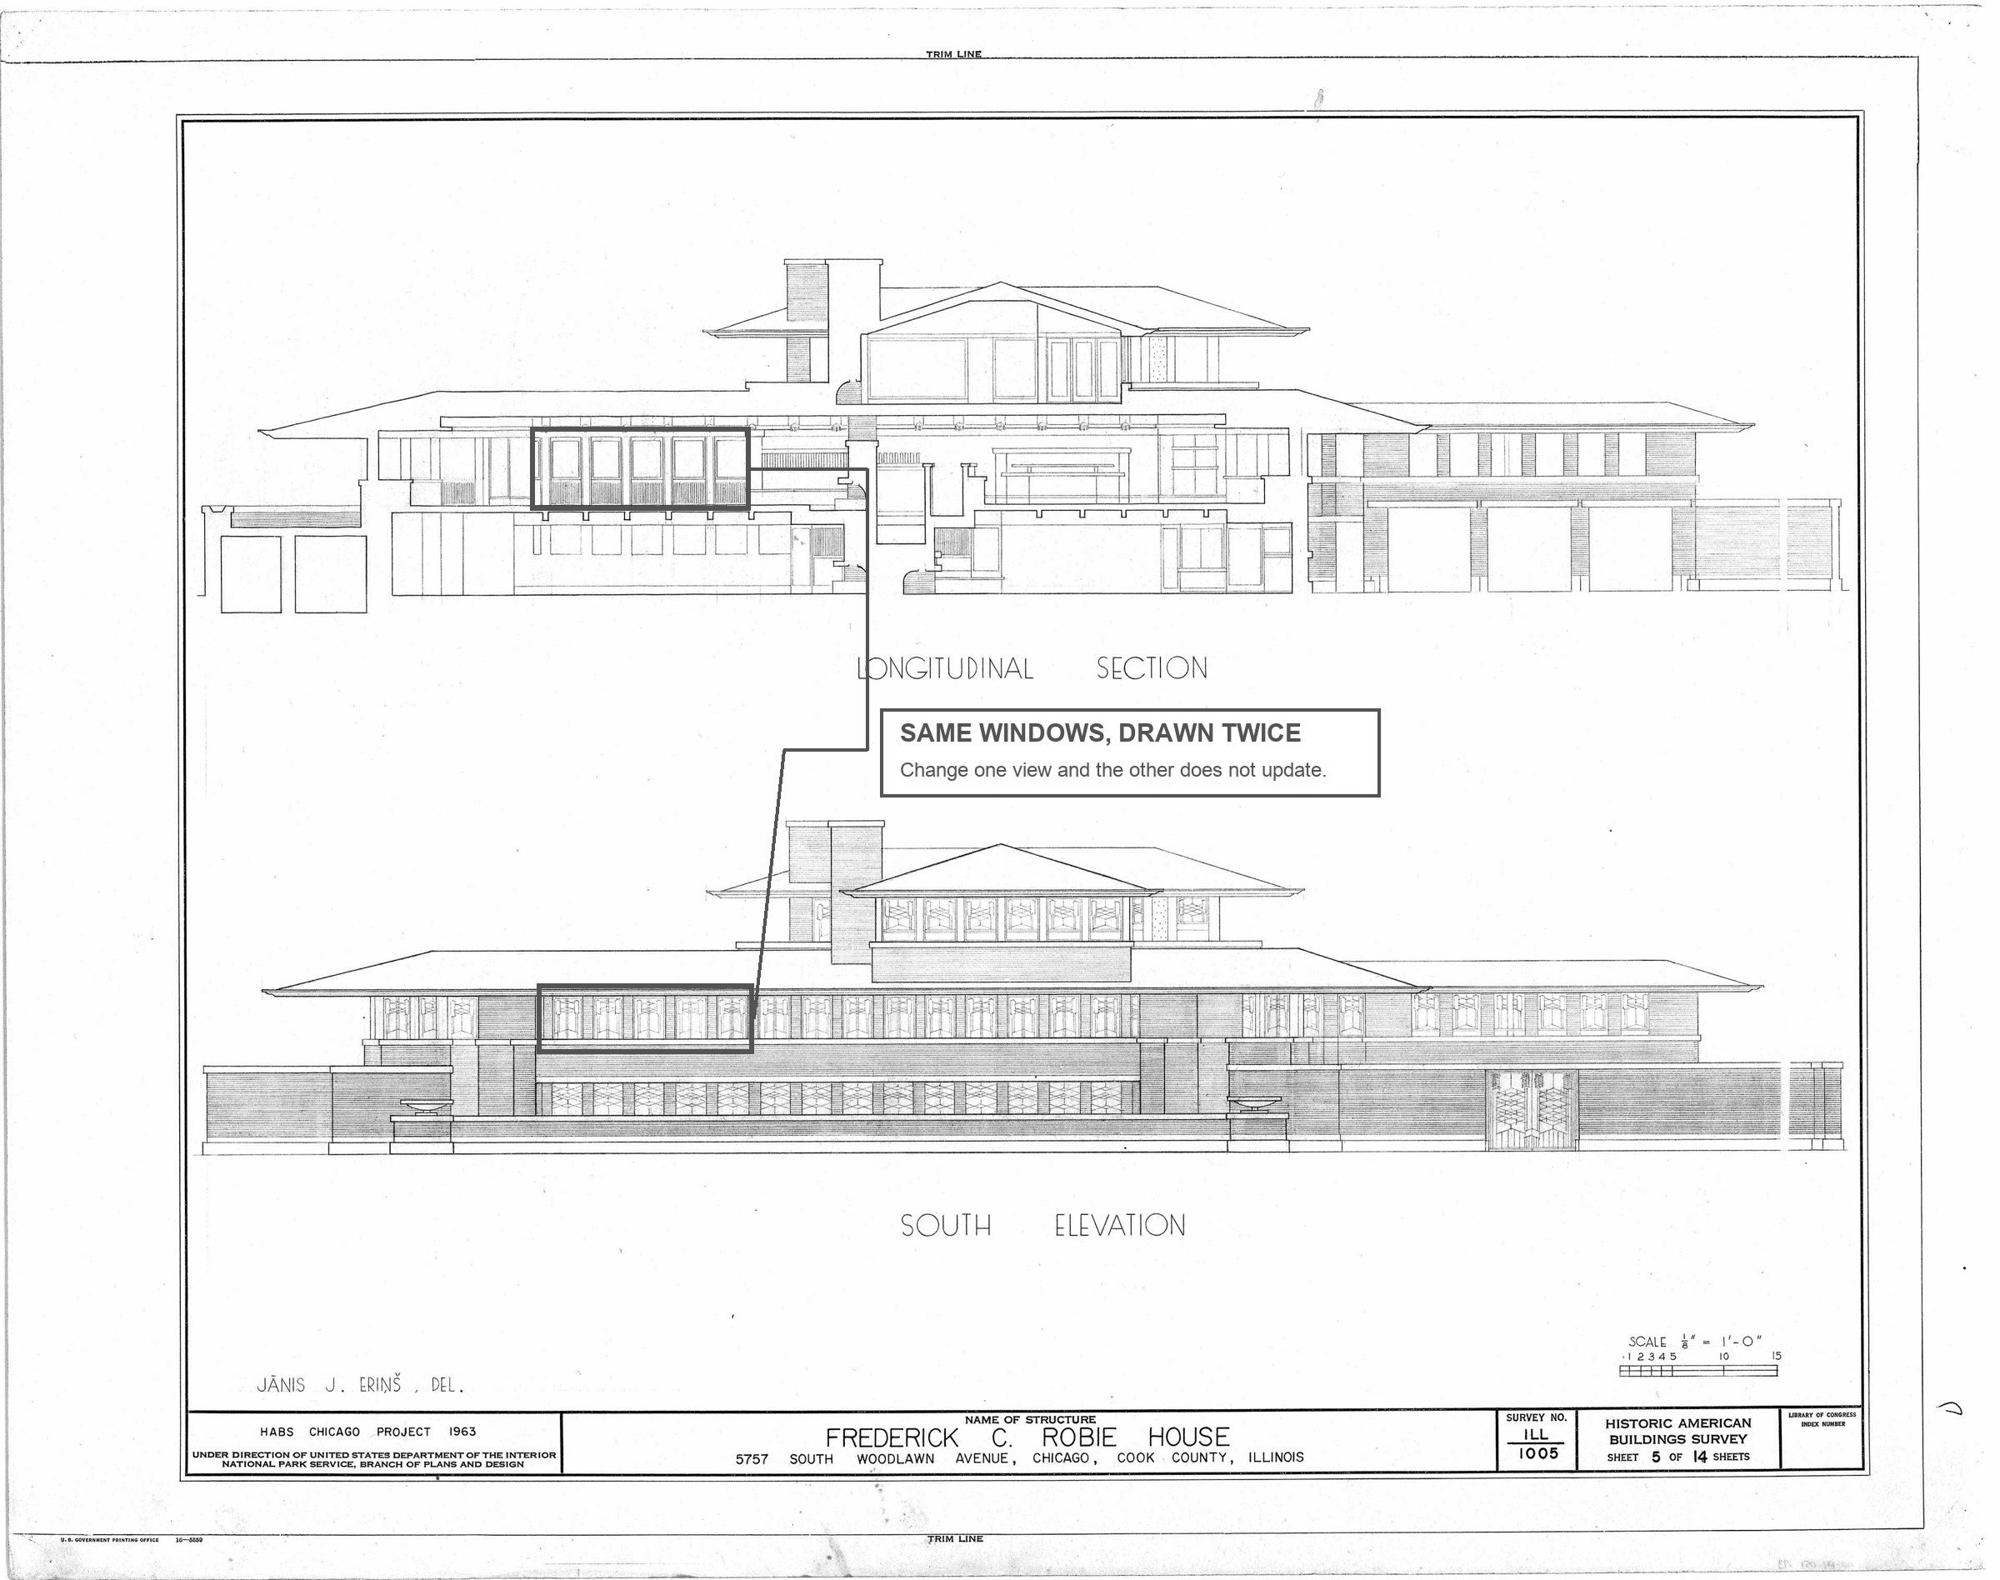
Historic American Buildings Survey, HABS ILL-1005, Library of Congress. Public domain.
An old and brilliant compromise
None of this means drawings were a mistake. They were one of humanity's most successful information technologies. Renaissance theorists such as Leon Battista Alberti, writing around 1450, already insisted that an architect's drawings should be measured plans and elevations rather than a painter's perspective, so that a builder could take dimensions from them. At the end of the eighteenth century the French mathematician Gaspard Monge formalised descriptive geometry, the rigorous method of representing three-dimensional objects on flat projections that engineering drawing still follows. In the nineteenth century cheap copying processes, most famously the cyanotype "blueprint", let one set of drawings be reproduced for many trades.
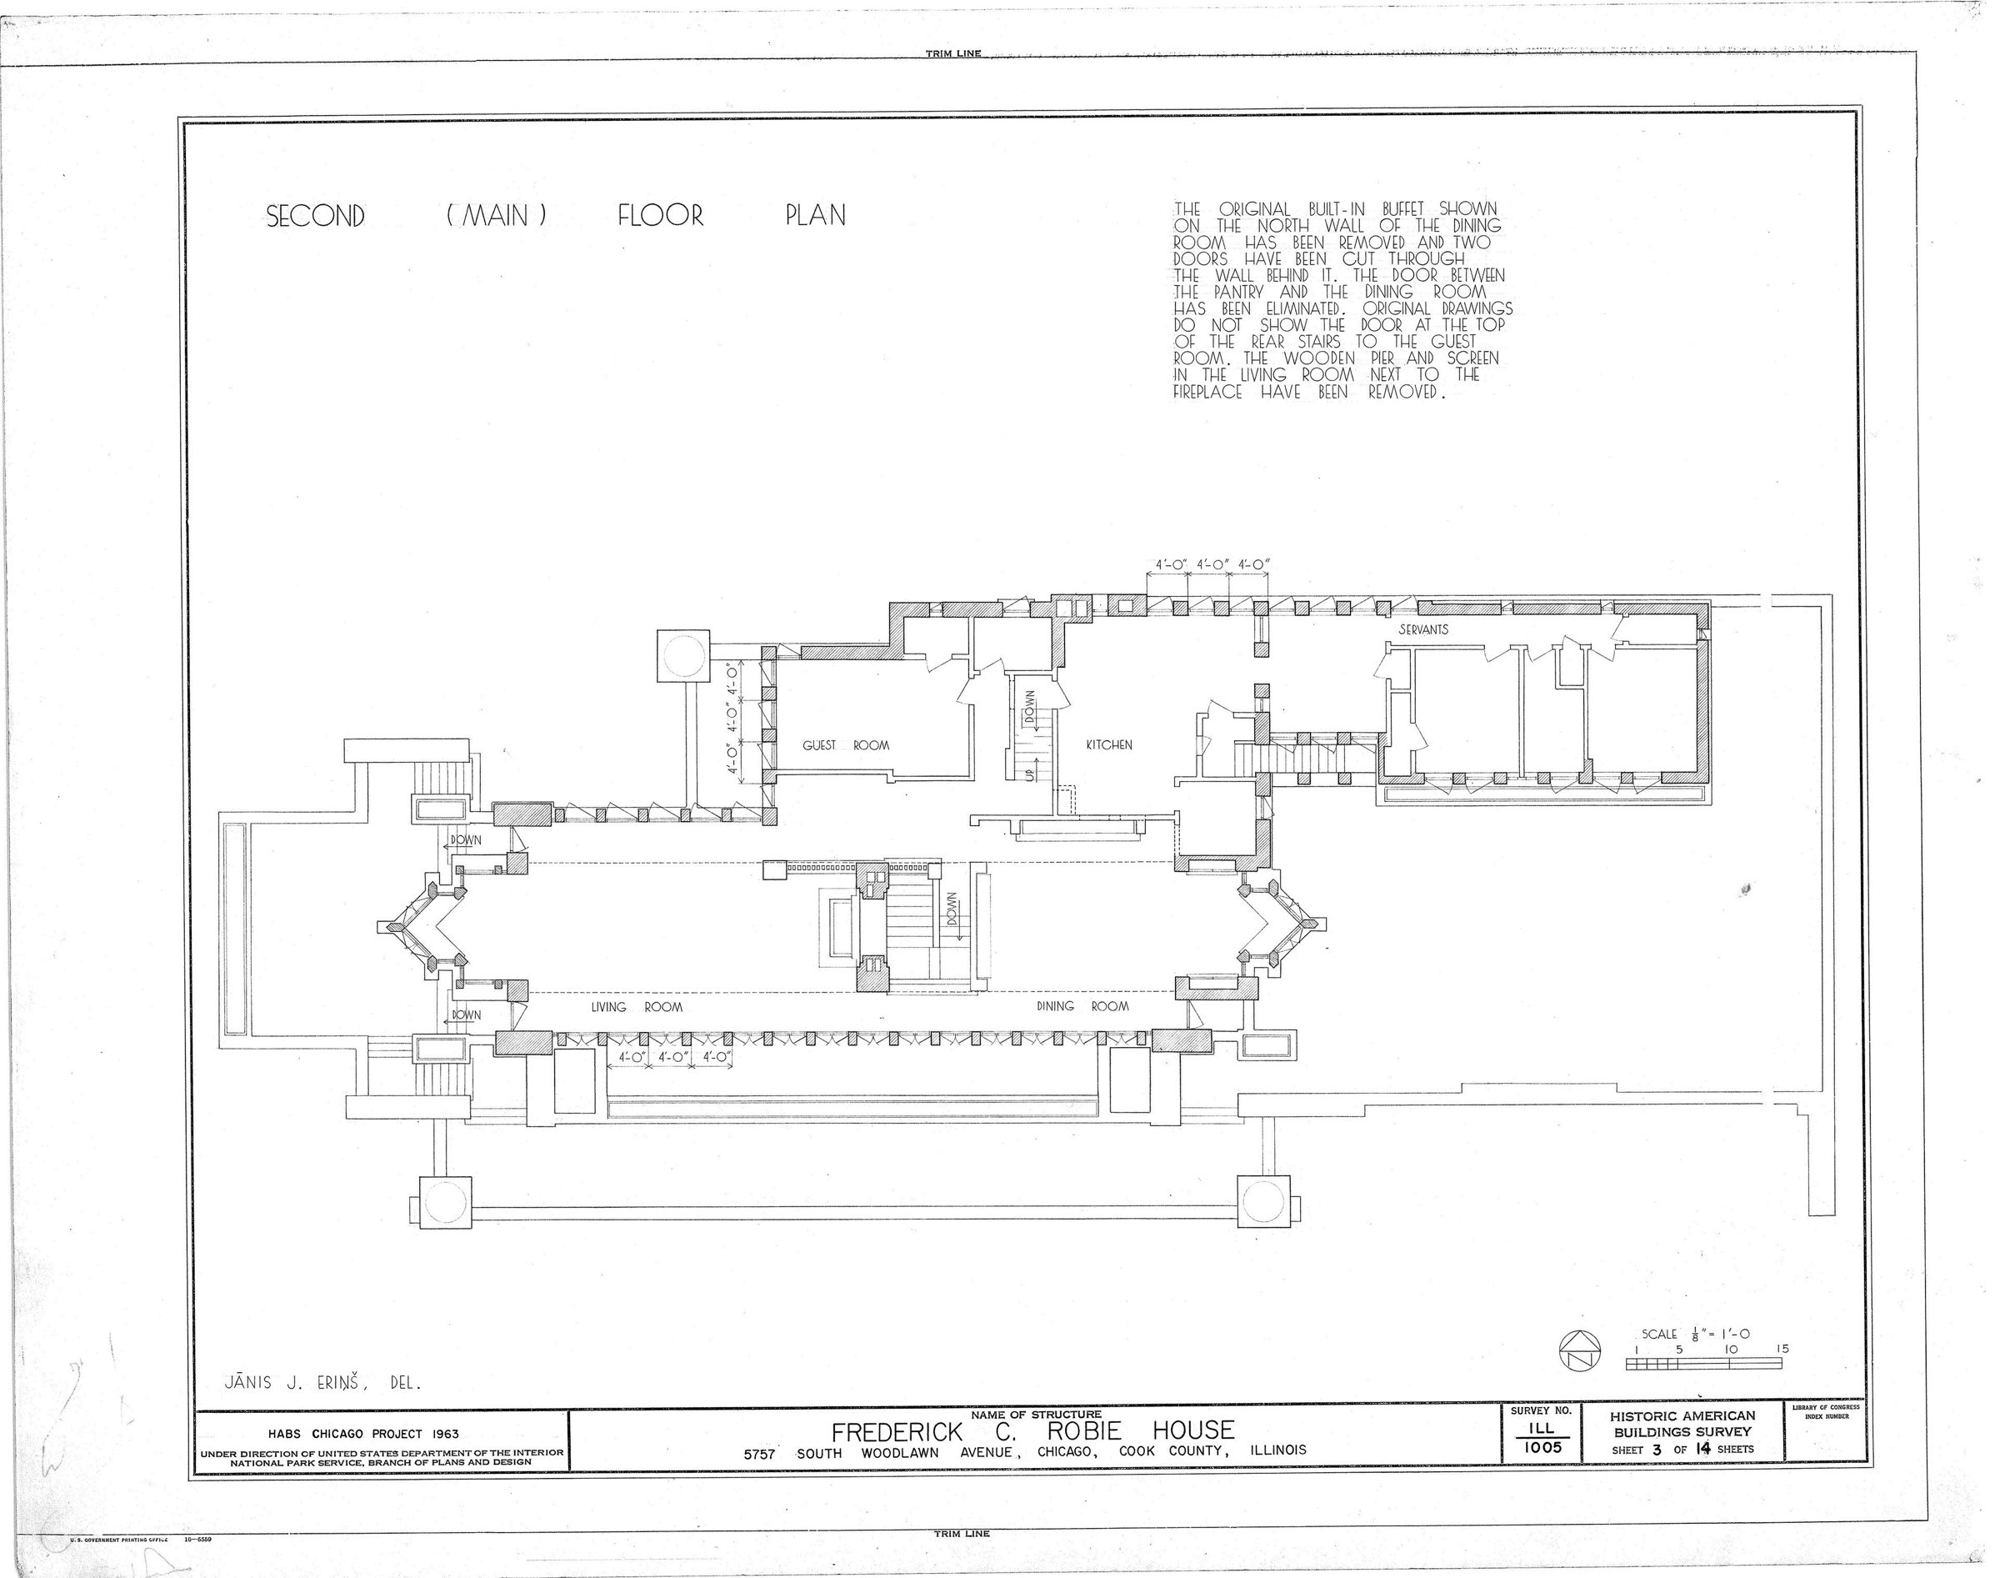
Historic American Buildings Survey, HABS ILL-1005, Library of Congress. Public domain.
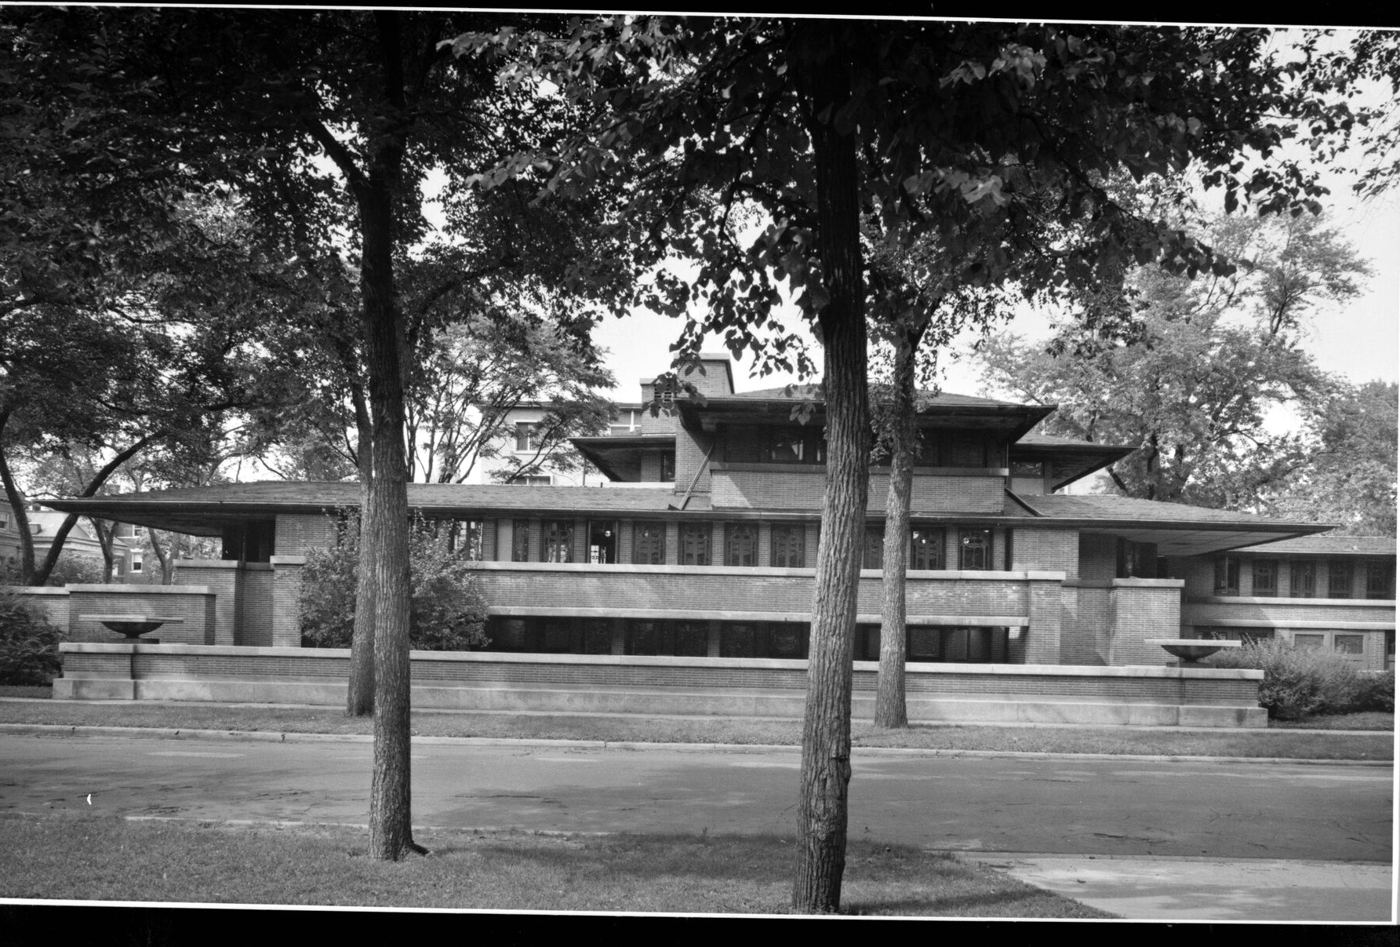
Historic American Buildings Survey. Public domain, via Wikimedia Commons. Cropped by ConstruBIM.
Drawings were compact, portable, legally robust and readable by anyone trained in the conventions. Their weakness was that they were a projection of a building, not a description of it. A plan tells you where a wall is. It does not tell you that the wall is fire-rated, who supplies it, how much it costs, or that three ducts pass through it. That information lived in schedules, specifications, calculations, and in people's heads.
What the computer first changed, and what it did not
When computers arrived in design offices they were first put to work making the old compromise faster. Computer-aided drafting, which spread rapidly after the launch of AutoCAD in 1982, digitised the pencil. The lines became vectors, the sheets became files, and copying and editing became trivial. But a line in a drafting file was still only a line. Move the door on the plan and nothing told the section.
This is the most important distinction in the whole history that follows, and it is worth stating plainly. Computer-aided design can be purely geometric. Building information modelling describes the building as a set of objects that know what they are, carry data, relate to one another, and generate the drawings as a by-product.
The remarkable fact, as the next chapters show, is that the second idea is almost as old as the first. It was described in detail in the 1970s, long before the industry had the machines, the incentives or the standards to use it.
Chapter 1 · 1957–1963
A Pen Made of Light
The first time a person drew on a computer screen, the drawing already knew rules.
The story of BIM begins, like much of modern computing, in the United States during the Cold War, with machines that filled rooms and cost more than buildings.
By the late 1950s the aerospace and automotive industries had begun using computers to control machine tools. Patrick Hanratty's PRONTO system, developed in 1957, is often cited as the first commercial numerical-control programming system and earned him the informal title of a father of CAD/CAM. These systems dealt in geometry for manufacturing. They had nothing to say about architecture. But they established that a shape could be stored as data and turned directly into a physical thing.
1962An architect at a console
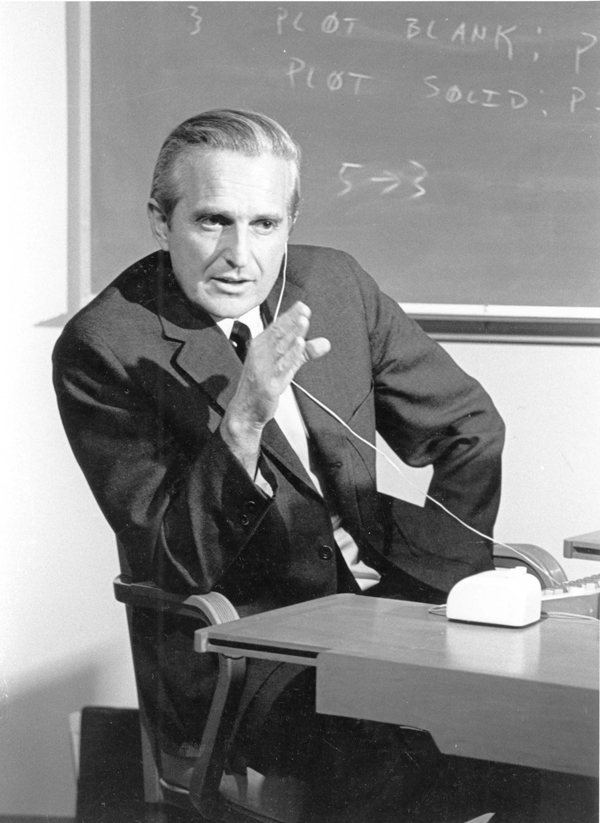
SRI International. CC BY-SA 3.0, via Wikimedia Commons.
In 1962 Douglas Engelbart, a researcher at the Stanford Research Institute, published a report titled Augmenting Human Intellect: A Conceptual Framework. It is famous as the intellectual seed of the mouse, hypertext and the modern graphical computer. Less often remembered is one of the scenarios Engelbart used to explain his vision: an architect, working at a computer workstation, designing a building.
In Engelbart's description the architect does not draw lines. He enters specifications, the machine assembles them, and he examines and adjusts the result from different points of view while the computer keeps track of the underlying data. In Engelbart's own words, "A structure is taking shape." Read with modern eyes, it is a startlingly close sketch of what BIM authoring became forty years later. Engelbart had no software to do it. He was describing a way of thinking.
1963Sketchpad
The following year a doctoral student at MIT turned part of that way of thinking into a working program. Ivan Sutherland's thesis, Sketchpad: A Man-Machine Graphical Communication System, ran on the TX-2 computer at MIT's Lincoln Laboratory. The user drew directly on a cathode-ray screen with a light pen.
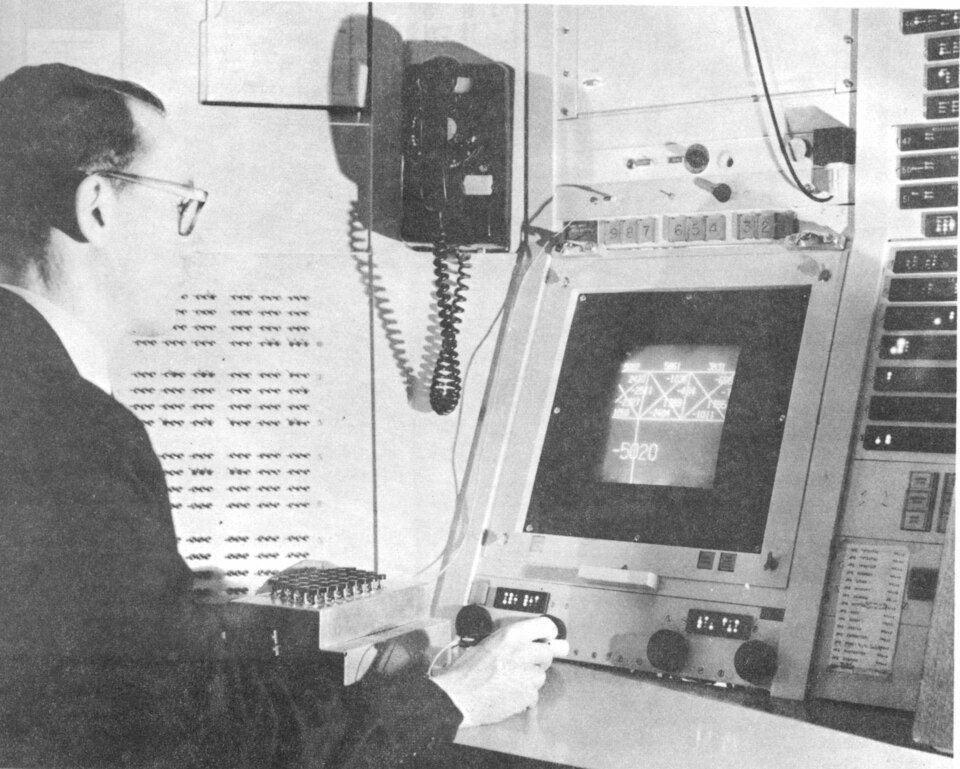
Ivan Sutherland; scan by Kerry Rodden. CC BY-SA 3.0, via Wikimedia Commons.
That alone made Sketchpad a landmark: it is widely regarded as the ancestor of every computer-aided design program and one of the first complete graphical user interfaces. But two of its ideas matter especially for our story.
The first was constraints. In Sketchpad you could tell the machine that two lines must stay parallel, that a line must keep a certain length, or that a joint must stay attached. Change one element and the program adjusted the others to keep the rules true. This is the direct ancestor of parametric modelling: the idea that a design is a set of relationships, not just a set of shapes.
The second was the master and instance. A shape could be defined once as a master and then placed many times as instances. Change the master and every instance changed. Anyone who has edited a door family in Revit, a GDL object in Archicad or a block in AutoCAD has used Sutherland's idea.
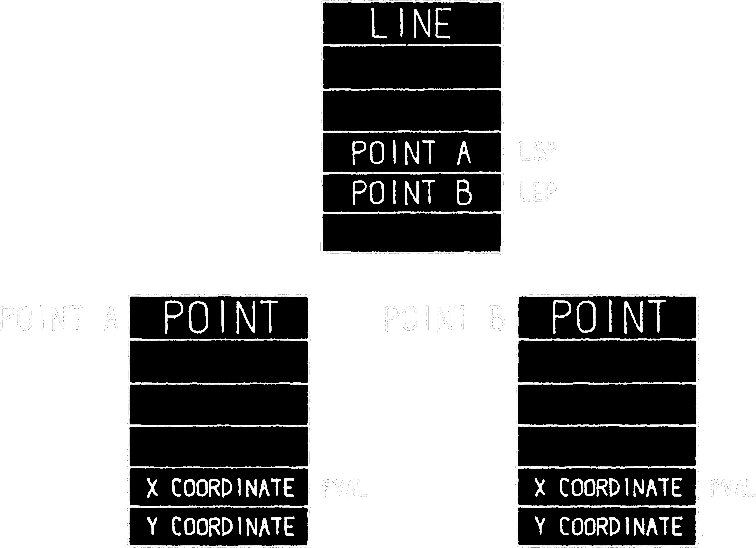
Sutherland, Ivan Edward. CC0, via Wikimedia Commons. Inverted to black on white by ConstruBIM.
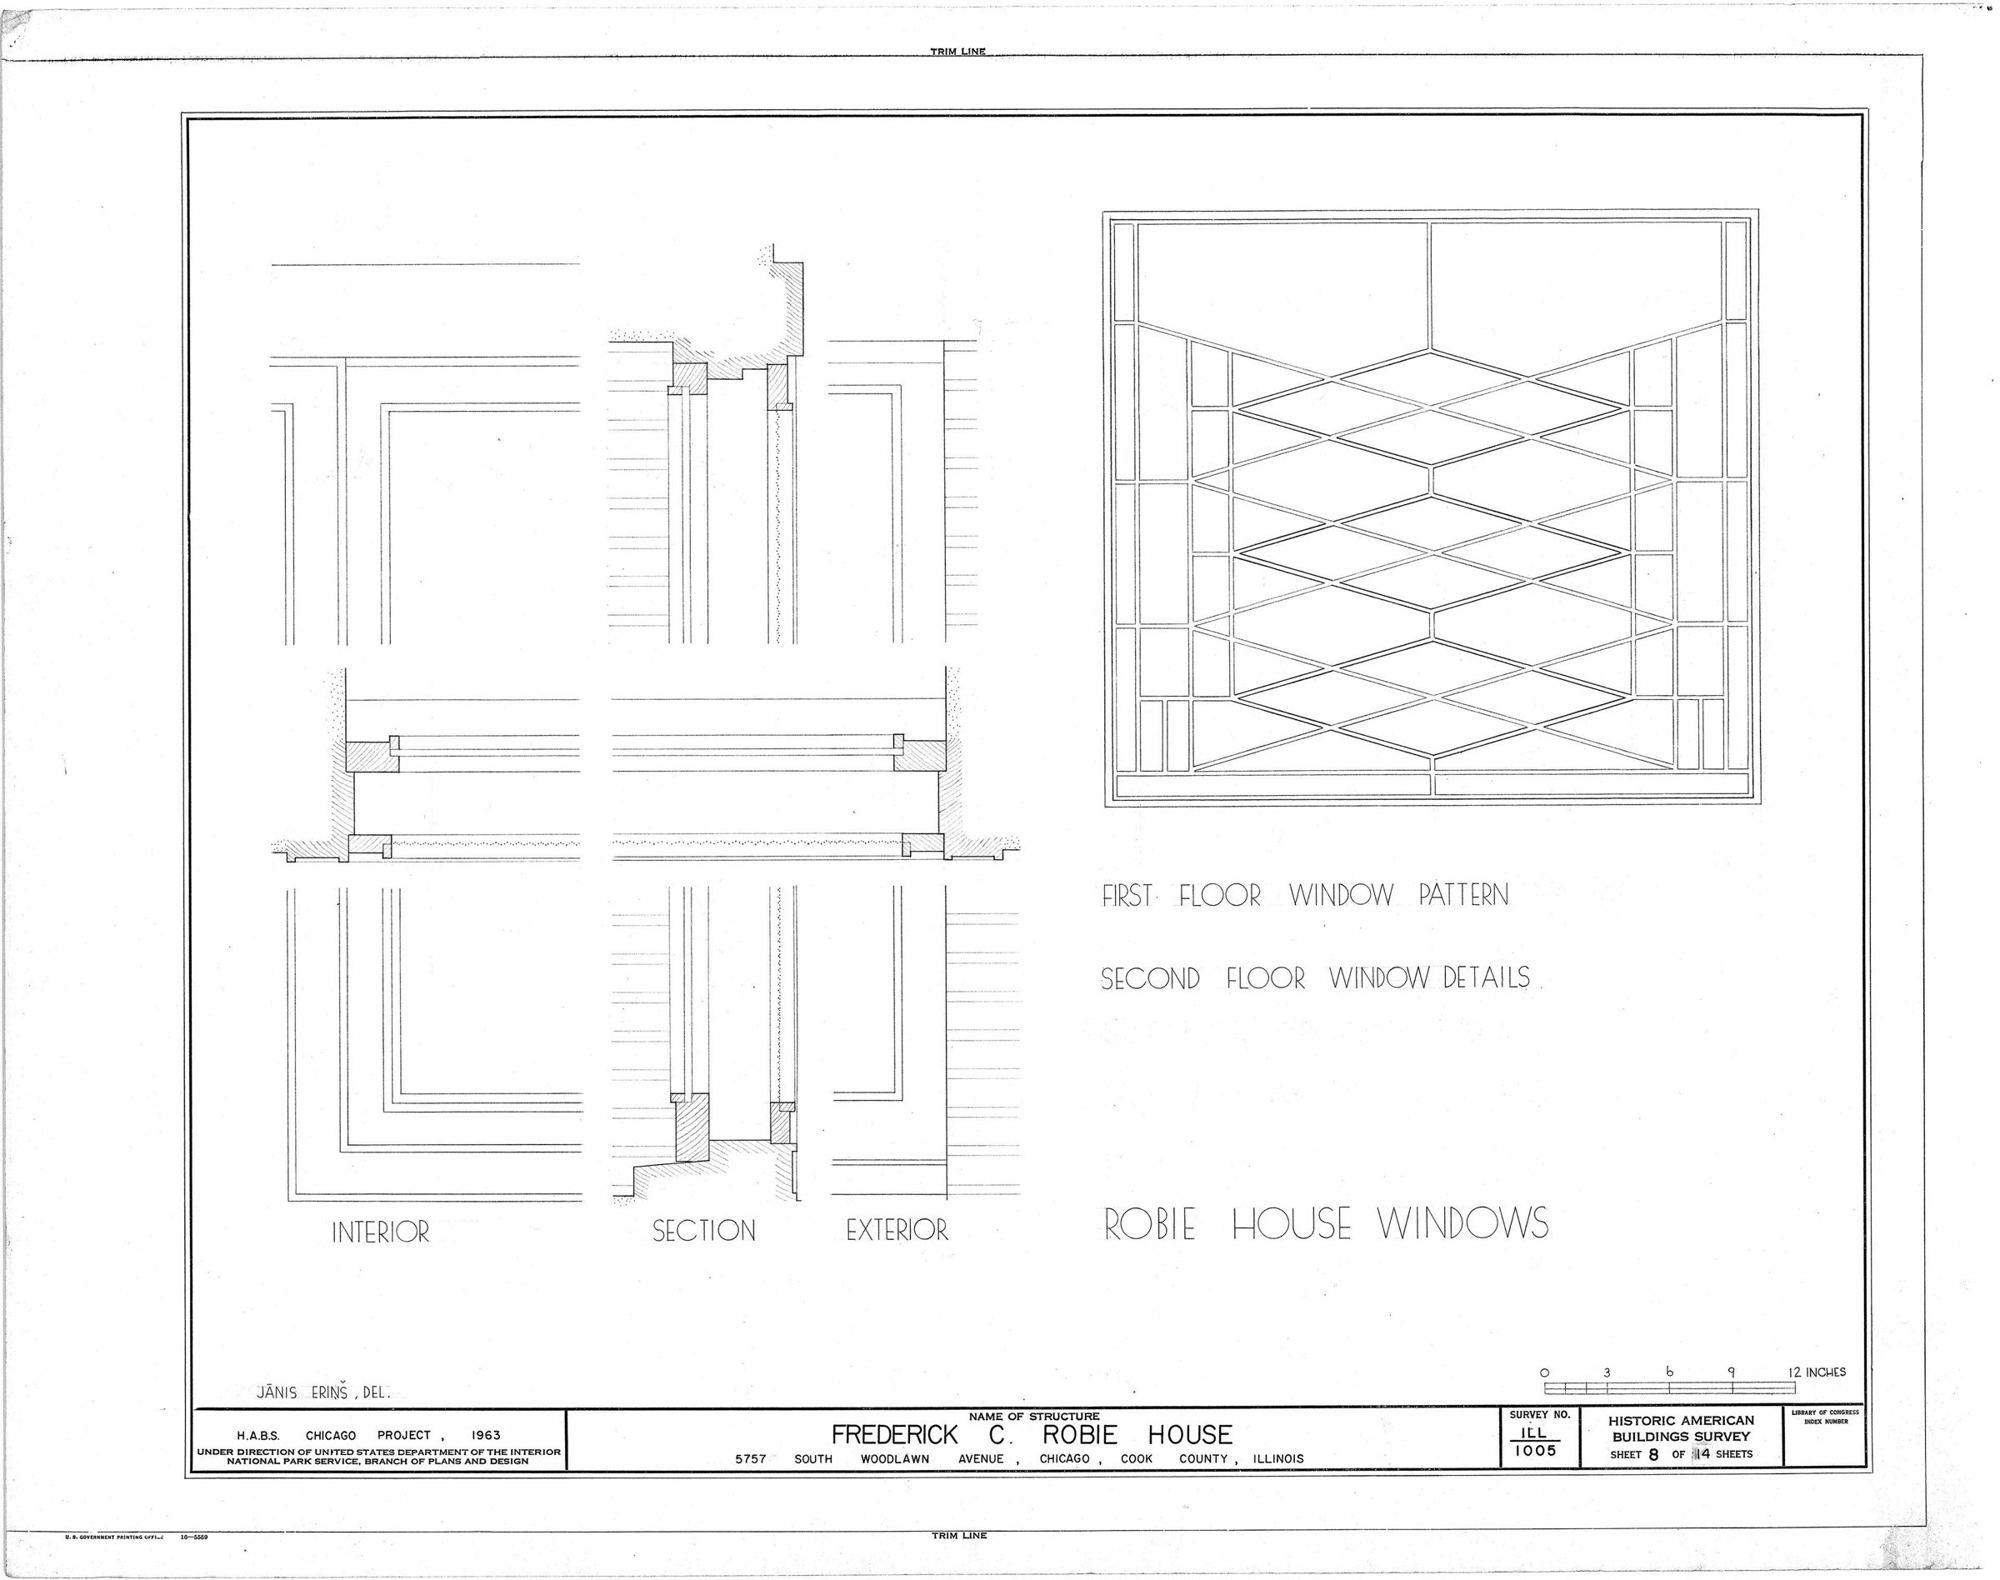
Historic American Buildings Survey, HABS ILL-1005, Library of Congress. Public domain.

Dick Lyon. CC BY-SA 3.0, via Wikimedia Commons.
Sutherland received the Turing Award, computing's highest honour, in 1988. Sketchpad itself was never an architectural tool. The TX-2 was a unique research machine, and the hardware to run such programs in an architect's office would not exist for another two decades. But from 1963 onward the principle was established: a drawing on a computer could be a structured model governed by rules, rather than a picture.
When a modeller asks why a Revit wall "refuses" to move, or why a Dynamo graph breaks after a type is renamed, they are meeting Sutherland's constraints and instances. Parametric behaviour is not a feature added to BIM; it is the oldest layer of the technology.
The missing ingredient
What Sketchpad did not have was meaning. Its lines were constrained, but a line did not know that it was a wall. The leap from geometry with rules to building elements with information would come a decade later, from a young professor at Carnegie Mellon who had studied architecture and who thought drawings were a remarkably inefficient way to describe a building.
Chapter 2 · 1967–1982
The Professor Who Refused to Draw
Describe the building once, as elements, and let the drawings follow. It took the industry forty years to take the advice.
Charles M. Eastman was born in 1940 and joined Carnegie Mellon University in Pittsburgh in 1967. His early research was not about software at all but about how designers think. A 1969 paper on the cognitive processes of design is regarded as one of the first studies in the field of design cognition. That interest, in how designers actually hold and manipulate information, shaped everything he built afterwards.
1964–1969A generation thinking about design and computation
Eastman was not working alone. Through the 1960s a small group of thinkers began to treat design itself as something that could be analysed, structured and partly computed. Christopher Alexander's Notes on the Synthesis of Form (1964) described design problems as networks of interacting requirements. Nicholas Negroponte founded the Architecture Machine Group at MIT in 1967 to explore how computers and architects might work together. Herbert Simon's The Sciences of the Artificial (1969) argued that design is a science of its own. In the same year Ian McHarg's Design with Nature layered environmental data over maps, a method that anticipated geographic information systems. BIM would inherit something from each: structured requirements, human–computer collaboration, a theory of design, and layered data.
1970sThe Building Description System
In the mid-1970s Eastman and his colleagues developed a prototype called the Building Description System, or BDS. In 1975 he set out its argument in a paper whose title reads today like a manifesto: The Use of Computers Instead of Drawings in Building Design.
Eastman's reasoning went to the heart of the paper problem described in the prologue. Drawings, he argued, are redundant: the same information is restated across many sheets, and every change must be repeated by hand on each of them, which guarantees inconsistency. They are also incomplete: a drawing shows geometry but cannot be interrogated for quantities, costs or performance.
His proposal was to describe the building in a single integrated database of elements. From that one description the system would produce plans, sections and perspectives, and would also support quantitative analysis. A change made once would appear consistently everywhere. The elements could be defined parametrically, and the database could be sorted and queried by attributes such as material or supplier.
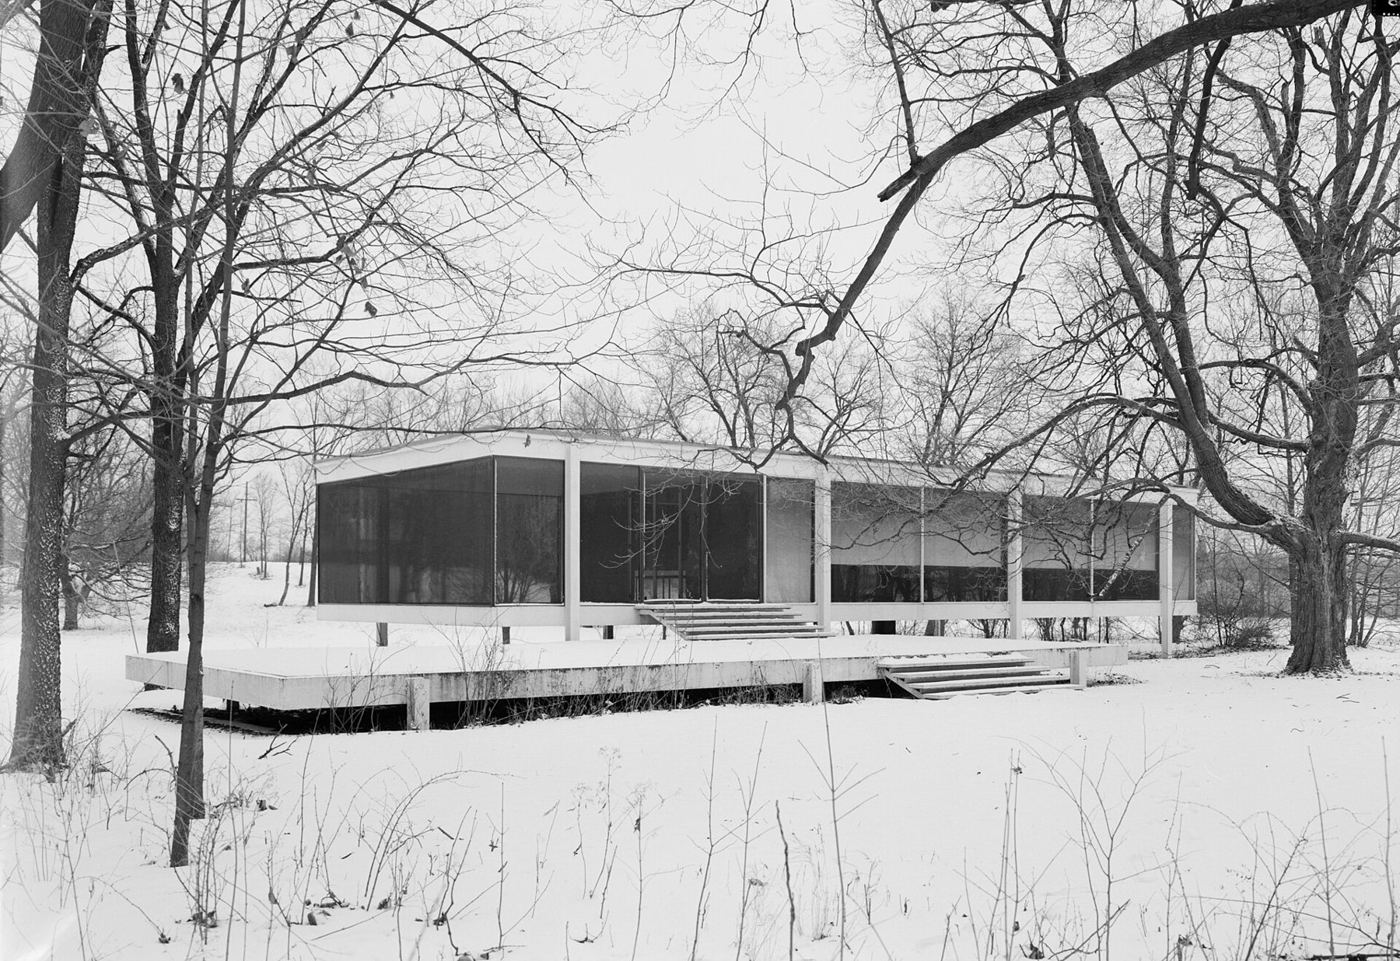
Jack E. Boucher, photographer. Public domain, via Wikimedia Commons.
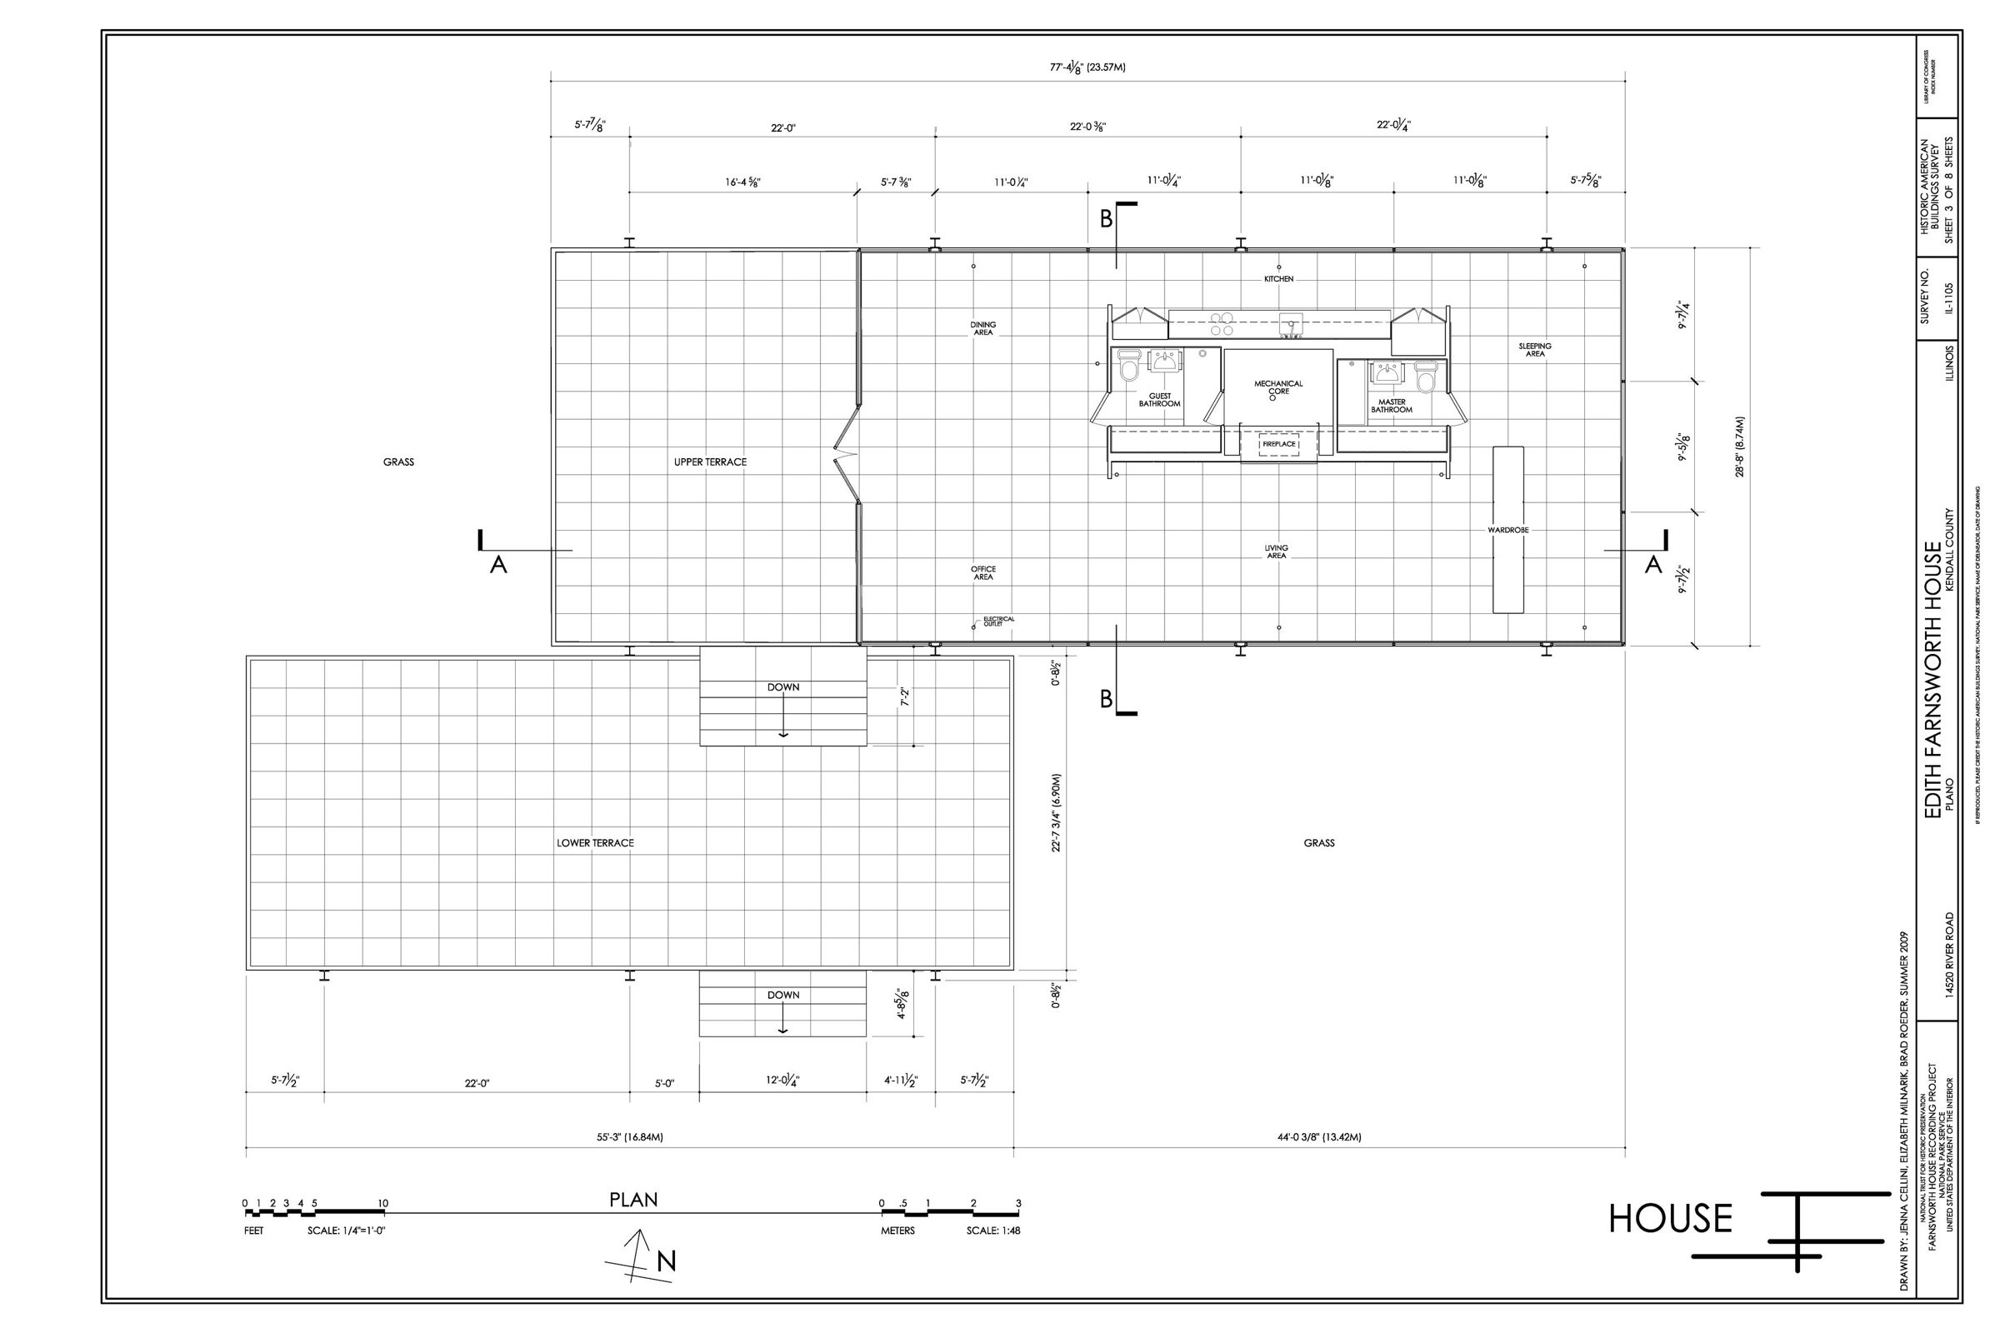
Historic American Buildings Survey, HABS IL-1105, Library of Congress. Public domain.
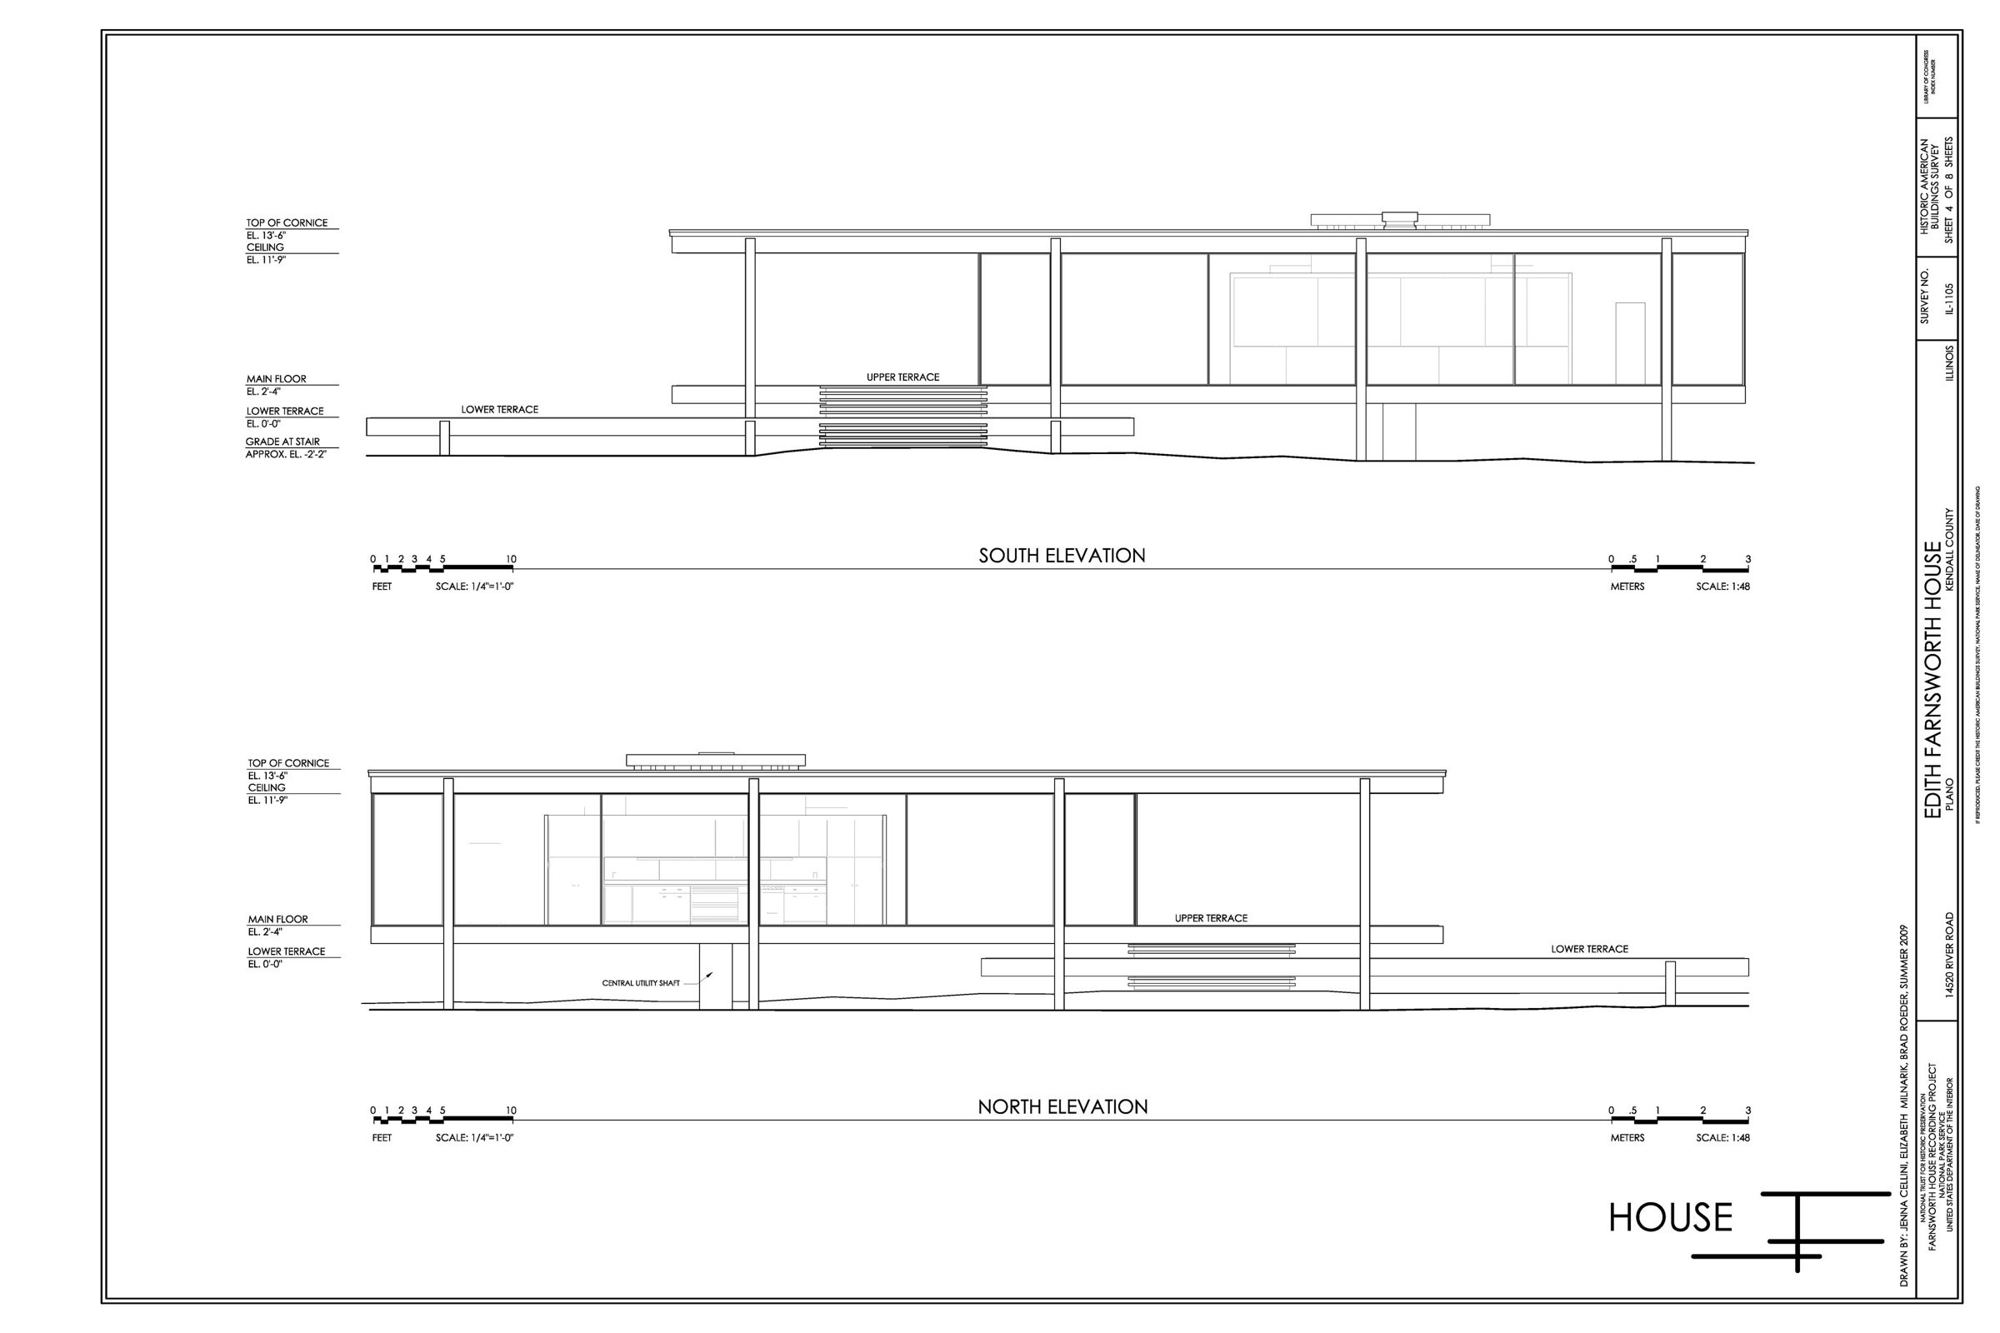
Historic American Buildings Survey, HABS IL-1105, Library of Congress. Public domain.
Read that list again and it describes, almost feature for feature, the pitch of every BIM vendor of the 2000s. Eastman had the concept complete. What he did not have was a computer an architecture practice could afford, a screen that could display a complex model at a usable speed, or an industry that saw any reason to change.
1970sGLIDE and solid modelling
At Carnegie Mellon Eastman also led work on GLIDE, the Graphical Language for Interactive Design, research into solid modelling that was supported by the US Army Corps of Engineers. Solid modelling, the ability to represent objects as closed volumes rather than collections of surfaces or edges, was a necessary step. A wall that is a true solid can be cut, measured and checked for intersection with a duct. A wall drawn as two lines cannot.
From research to industry, and back
In 1982 Eastman founded a start-up, Formtek, to commercialise parametric modelling, and sold it to Lockheed in 1987. The destination is telling. In the 1980s the people who could pay for information-rich product models were aerospace and defence companies, not architects. The construction industry was fragmented into thousands of small firms, worked project by project, and was paid for drawings. The technology went where the money was.
Eastman returned to academia, first at UCLA and then, from 1996 to 2018, at the Georgia Institute of Technology, where he became the field's most influential teacher. He founded the professional community ACADIA and helped establish CIB W78, the international working group on information technology for construction. In 1999 he published Building Product Models, and in 2008, with Paul Teicholz, Rafael Sacks and Kathleen Liston, the BIM Handbook, which became the standard textbook for a generation of students and practitioners.
Charles Eastman died in November 2020. By then the idea he had described in 1975 had become an international standard, a legal requirement in several countries and a multi-billion-dollar software market. The industry did not lack the idea for forty years. It lacked the hardware first, then the incentive, and then a common language.
BIM is sometimes presented as a product of the 2000s software industry. In fact its core principles, including a single integrated database, parametric elements, derived drawings and quantity analysis, were published in 1975. What the 2000s delivered was affordability and adoption, not the concept.
Chapter 3 · 1970s–1996
The Liverpool Line
While American research described the building model, a small British lineage of engineers quietly built one and used it on real projects.
The popular history of BIM tends to leap from Eastman's research straight to Graphisoft and Autodesk. That skips one of the most interesting chapters, which unfolded in Britain and produced some of the first building modelling systems used on commercial architecture.
1970sRUCAPS
In the early 1970s two graduates of Liverpool University, Dr John Davison and John Watts, began developing a system that became known as RUCAPS. From the late 1970s it was developed and sold through GMW Computers, a company connected to the architectural practice GMW Architects, and commercial sales began in 1977. One of its early uses was on GMW's work for a large university project in Riyadh, Saudi Arabia.
RUCAPS ran on minicomputers made by Prime Computer and Digital Equipment Corporation, expensive machines far beyond the reach of most practices. What set it apart was that it did not simply store drawings. It worked with building components assembled in three dimensions, from which drawings could be produced, and it was used on large projects, including work at London's Heathrow Airport referenced in a 1986 paper by Robert Aish.
1985–86The words "building model"
The vocabulary of BIM arrived gradually, and this lineage supplied an important piece of it. The term building model, in something close to its present meaning, appears in a paper written by Simon Ruffle in 1985 and published in 1986, and in a 1986 paper by Robert Aish, who was then working at GMW Computers. Aish's paper discussed the use of building modelling in construction, including the sequencing of work, an idea that later matured into what we now call 4D.
Mid-1980sSonata and Reflex
By the mid-to-late 1980s RUCAPS was being superseded by a successor called Sonata, developed by Jonathan Ingram. Some accounts consider Sonata more advanced in its modelling approach than the PC-based tools emerging at the same time, but it still depended on expensive workstation hardware. GMW Computers was renamed T2 Solutions in 1987.
Ingram went on to develop another system, Reflex, which continued the object-based approach. In 1996 Reflex was acquired by Parametric Technology Corporation, PTC, the Massachusetts company whose Pro/ENGINEER software had brought feature-based parametric modelling to mechanical engineering in the late 1980s.
A thread through PTC
The next link in the chain should be stated carefully, because it is a link of people and ideas, not of software. PTC's Pro/ENGINEER had shown that engineers would pay for a modeller in which a change to one dimension propagated through a whole design. In 1997 two developers who had worked on Pro/ENGINEER, Leonid Raiz and Irwin Jungreis, left to found a company in Massachusetts with a simple ambition: to bring that kind of parametric modelling to buildings. Their product would be called Revit. Its story belongs to Chapter 8.
Robert Aish, meanwhile, went on to a long career in computational design. He led the development of GenerativeComponents at Bentley Systems and later DesignScript at Autodesk, work that fed into the visual and scripted design tools discussed in Chapter 12.
RUCAPS and Sonata ran on minicomputers and workstations that only a few firms could buy, and they did not survive the move to the personal computer. History tends to remember the products that reached the mass market, not the ones that proved the idea first.
Chapter 4 · 1982–1987
A Virtual Building in Budapest
The idea became software an ordinary architect could buy on the least likely side of the Iron Curtain.
In 1982 the most important obstacle to building modelling was not intellectual. It was economic. A model-based system needed a powerful computer, and powerful computers cost as much as a small office. The breakthrough that finally put a building model on an architect's desk came from Budapest, in communist Hungary, at a time when Western computer technology was difficult and politically complicated to obtain in the Eastern Bloc.
1982Graphisoft
Graphisoft was founded in Budapest in 1982 by Gábor Bojár. The company's first work was terrain modelling software for microcomputers, which required representing real three-dimensional surfaces efficiently on very modest hardware. That constraint turned out to be excellent preparation.
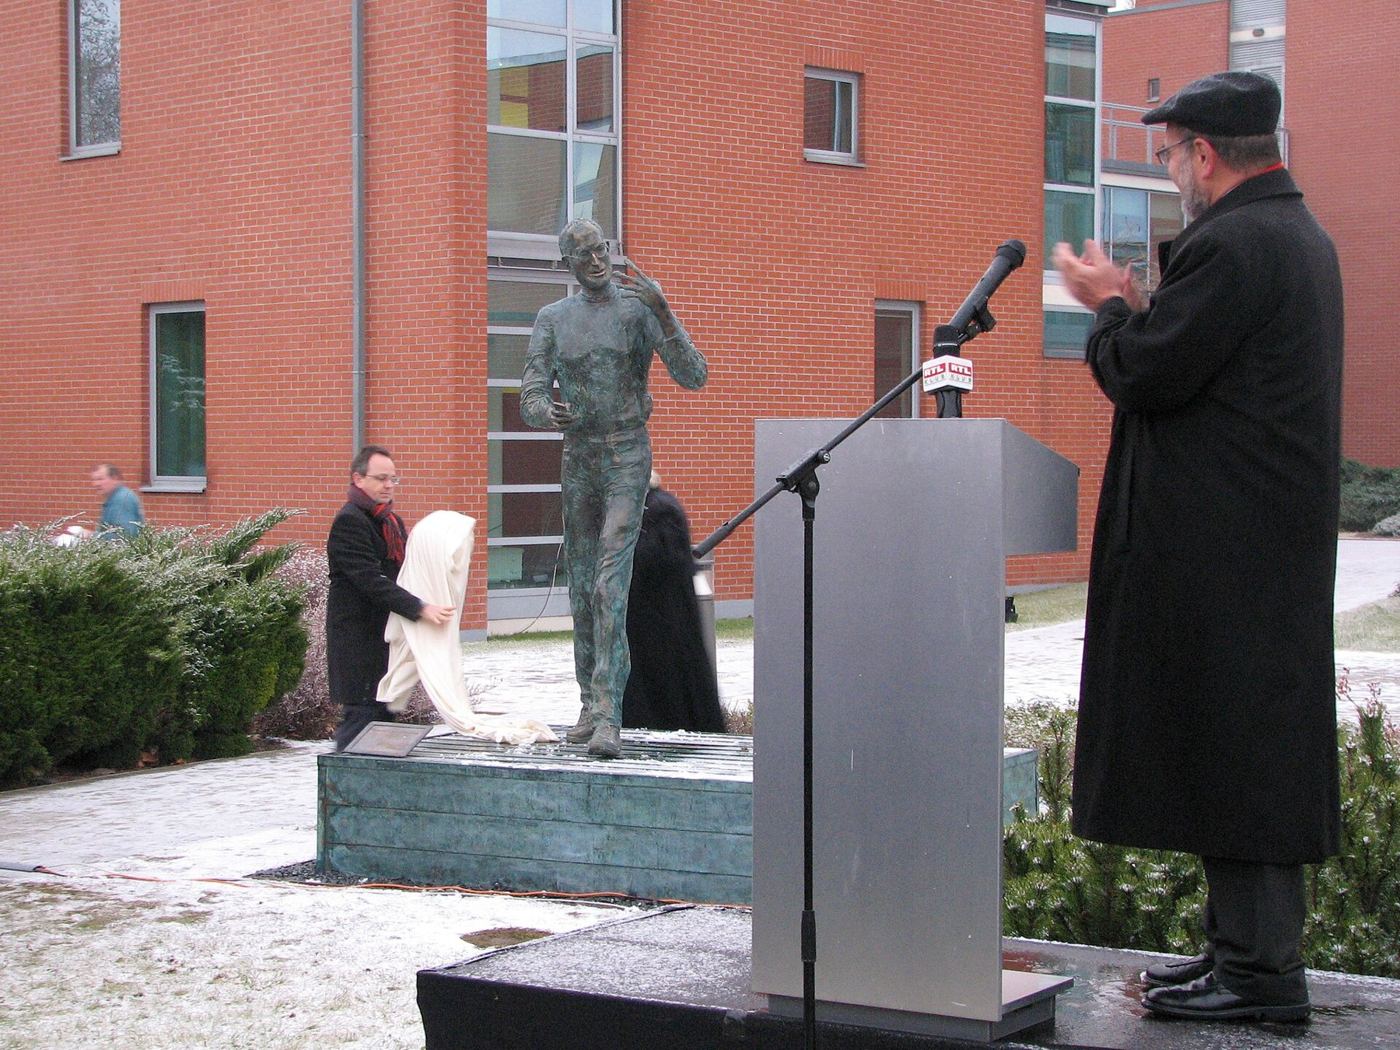
In 1984 Bojár met Steve Jobs at a trade fair in Germany. Jobs was looking for software that showed what Apple's machines could do; Bojár needed hardware good enough to run a three-dimensional building modeller. Graphisoft's early architectural software was shown running on the Apple Lisa, a commercial failure as a computer but a showcase for the program. Western computers were subject to export restrictions behind the Iron Curtain, and company accounts relate that Macintosh computers had to be smuggled into Hungary so development could continue.
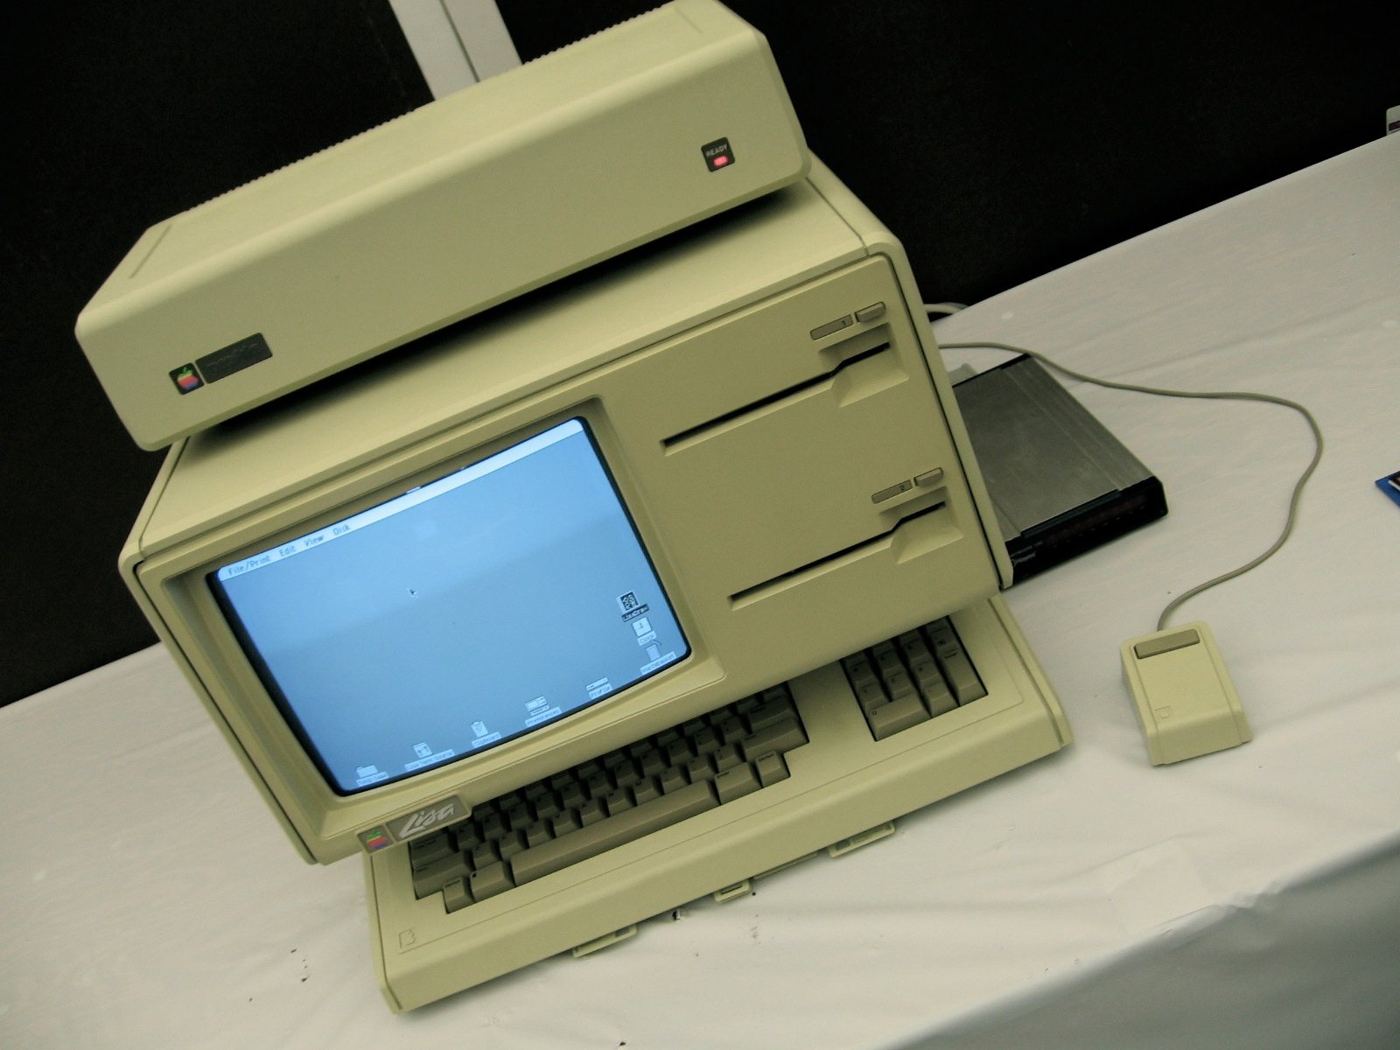
Marcin Wichary from San Francisco, Calif.. CC BY 2.0, via Wikimedia Commons.
From 1984 Graphisoft worked on Apple computers, and development began on an architectural product. The company's approach, which it called the Virtual Building, treated the design as a three-dimensional model of building elements, such as walls, slabs, roofs, doors and windows, from which plans, sections and elevations were generated.
1987ArchiCAD
ArchiCAD was released in 1987. It is often described as the first CAD product on a personal computer able to create both 2D drawings and a 3D model from the same underlying data, and some accounts regard it as the first commercial implementation of BIM. Whether one accepts that title or reserves it for RUCAPS and Sonata, the significance is clear: ArchiCAD ran on hardware that a practice could realistically buy. It moved building modelling from the research lab and the corporate minicomputer to the architect's desk.
The drafting detour
ArchiCAD's arrival did not trigger an immediate revolution, and the reason is instructive. The same decade saw computer-aided drafting sweep the industry. AutoCAD, launched in 1982, and Bentley's MicroStation, from a company founded in 1984 by Keith and Barry Bentley, digitised the drawing office at enormous scale. Drafting was an easy sell: it did what firms already did, faster, and it produced the deliverable clients paid for, which was a set of drawings.
Modelling was a harder sell. It demanded a different way of working, more upfront effort and more skilled people, and in return delivered benefits such as coordination, quantities and consistency that often accrued to someone else further down the supply chain. For most of the 1980s and 1990s, 2D CAD won. In hindsight it was a detour of roughly fifteen years, but it also trained a generation to design on screens, which made the eventual move to modelling possible.
Historic American Buildings Survey, HABS IL-1105, Library of Congress. Public domain.
Graphisoft afterwards
Tamás Rell. CC BY-SA 3.0, via Wikimedia Commons.
Graphisoft became one of the great survivors of the story. It listed on the Frankfurt Stock Exchange in 1998 and was acquired by the German Nemetschek Group in 2007. Its Teamwork technology, which let several people work on one model at the same time, anticipated the collaborative workflows that cloud platforms would later make universal. Archicad, as the product is now spelt, remains one of the leading BIM authoring tools in the world, especially in Europe, Japan and among architecture-led practices.
Chapter 5 · Part II · The name and the market · 1992
Whoever Wrote It Down First
The phrase "Building Information Model" was printed by two researchers in the Netherlands, a decade before any vendor used it.
By the early 1990s the field had many names for the same idea. Researchers spoke of product models and building product models. Graphisoft marketed the Virtual Building. Others used phrases such as integrated project model or single building model. The concept was converging. The vocabulary was not.
1992Delft
In 1992 two researchers, G. A. van Nederveen and F. P. Tolman, working in the Netherlands in the circle of Delft University of Technology, published a paper titled Modelling Multiple Views on Buildings in the journal Automation in Construction. Its subject was a problem that anyone who has coordinated a project will recognise: an architect, a structural engineer and a building services engineer look at the same building and need different information about it. The paper explored how one model could serve several such views.
In the course of that argument the paper used the term Building Information Model. It is, as far as the published record shows, the earliest documented use of the phrase. The name of the discipline that now employs millions of people was first written down not in a marketing brochure, but in an academic paper on the problem of multiple viewpoints.
A sentence circulates widely in tenders, training slides and even some textbooks: that BIM was "coined in 1992 by Jerry Laiserin, a British architect". It is wrong twice over.
The 1992 first use belongs to van Nederveen and Tolman. And Jerry Laiserin is an American industry analyst and writer, not a British architect. His real contribution came a decade later, and it was arguably more useful than coining a word, as the next section explains.
2002–2003Getting competitors to use one word
For the rest of the 1990s the phrase stayed largely inside the research community. Then, around the turn of the millennium, the major software vendors converged on the idea at the same moment, each under its own banner. Autodesk had acquired Revit and was about to publish a white paper titled Building Information Modeling. Bentley Systems was promoting its own integrated project modelling approach. Graphisoft still spoke of the Virtual Building.
Jerry Laiserin, writing in his newsletter in 2002 and then convening a public exchange with Autodesk, Bentley and Graphisoft in 2003, argued that the industry should standardise on a single term for this shared concept, and that the term should be Building Information Modeling. The vendors, who were competitors with every reason to protect their own labels, broadly agreed. Laiserin helped popularise and standardise the name rather than invent it.
Model, modelling, management
The acronym has since been stretched in several directions. Building Information Model is the thing: the structured digital description of an asset. Building Information Modelling (or Modeling, in American spelling) is the activity of creating and using it. In the 2010s some practitioners began to speak of Building Information Management, to emphasise that the value lies in governing information rather than making geometry. ISO 19650, the international standard discussed in Chapter 10, largely sidesteps the argument by speaking of information management using building information modelling. All three meanings are legitimate. The history shows why the third one eventually became necessary.
Chapter 6 · 1977–2014
Borrowing the Aircraft Industry's Brain
Some buildings were simply impossible to describe on paper. Their architects went looking for the software that designed jets.
While architecture spent the 1980s and 1990s drafting in 2D, the aerospace and automotive industries were modelling in 3D and building the software to do it. The most influential of those programs was CATIA.
1977A French fighter-jet program
CATIA began in 1977 at Avions Marcel Dassault, the French aircraft manufacturer, as an in-house tool for designing aircraft. It was later commercialised by Dassault Systèmes and became one of the dominant 3D product design systems in the world. Its best-known triumph in the early 1990s was the Boeing 777, widely described as the first commercial airliner designed entirely on computer, with digital pre-assembly used to check that parts fitted before anything was built. The idea of catching clashes in a model before they reach the factory floor, which the construction industry would later adopt as clash detection, was proven first on aircraft.

Aero Icarus from Zürich, Switzerland. CC BY-SA 2.0, via Wikimedia Commons.
Early 1990sFrank Gehry's fish
Eric Richardson. CC BY 2.0, via Wikimedia Commons.
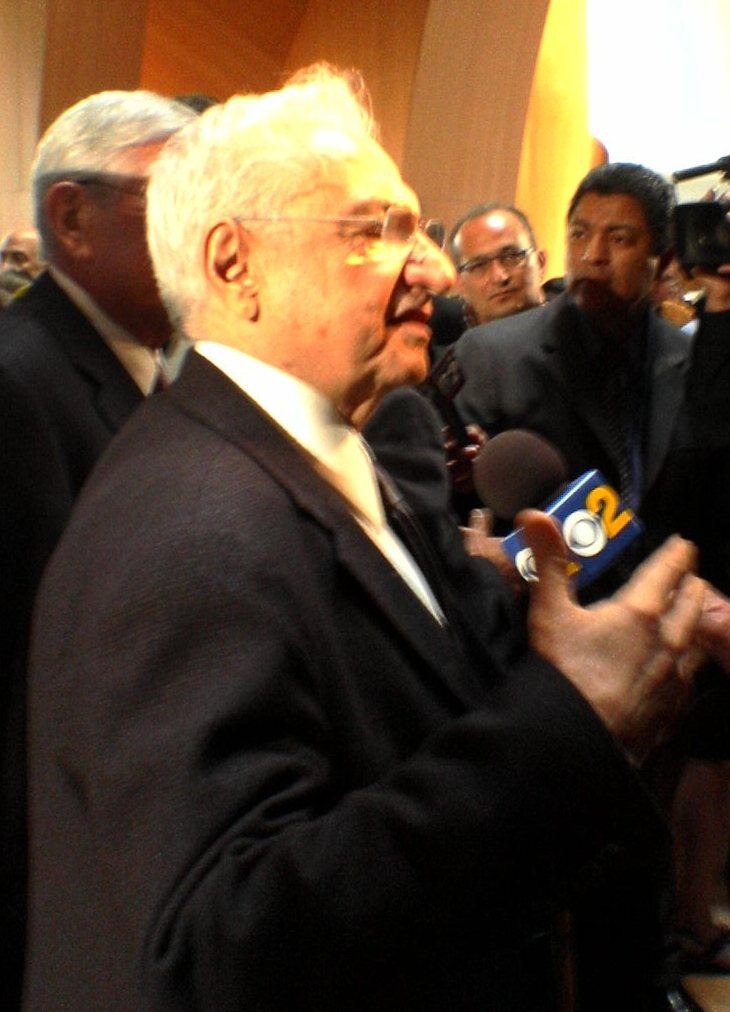
The architect Frank Gehry was famous for sculptural, curving forms that were extraordinarily difficult to draw, dimension and build using conventional documents. In the early 1990s his office, led in its technology efforts by partner Jim Glymph, adopted CATIA to translate physical models into precise digital geometry that fabricators could use. The turning point was the large fish-shaped sculpture Gehry designed for Barcelona's Olympic waterfront in 1992. Accounts of the project describe a contractor repeatedly failing to build a mock-up from two-dimensional drawings, until Glymph turned to CATIA and the sculpture was delivered from the digital model.
The approach went far beyond visualisation. The digital model became the reference from which steel and cladding fabricators worked, reducing the ambiguity that would otherwise have made such forms prohibitively expensive or impossible to build.

Luis Miguel Bugallo Sánchez (Lmbuga). CC BY-SA 4.0, via Wikimedia Commons.
1997Bilbao
The Guggenheim Museum Bilbao, which opened in 1997, made the method world-famous. Its titanium-clad curves could not have been delivered through a traditional drawing process at anything like the cost and time achieved. The building did something no white paper could: it showed architects, clients and contractors that a computational model could be the working heart of a complex building, not just a way to make pictures of it.
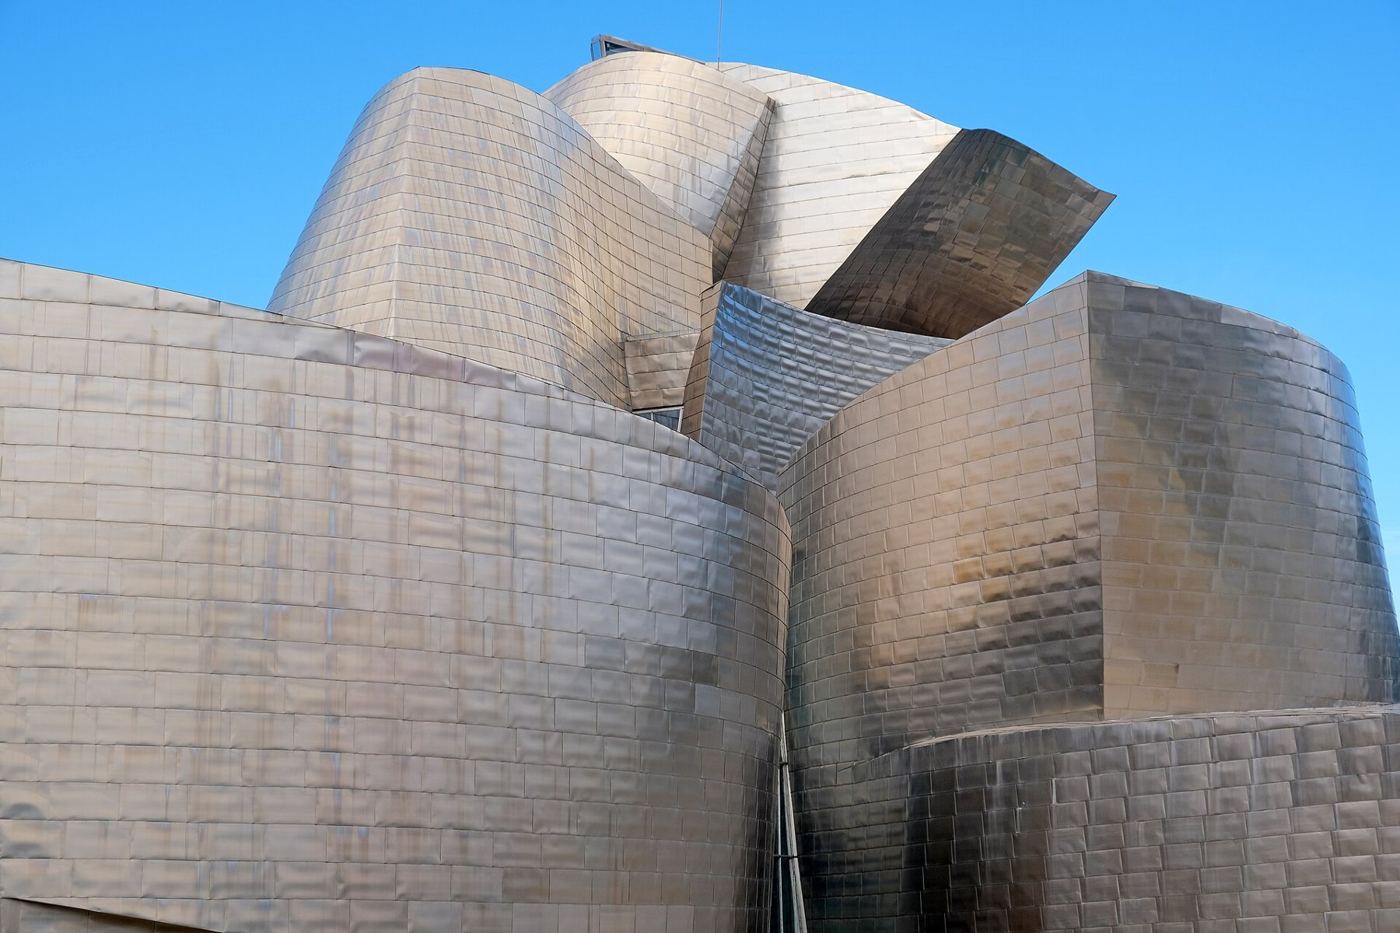
kallerna. CC BY-SA 4.0, via Wikimedia Commons.

2002–2014Gehry Technologies and Digital Project
Gehry's office went on to design the Walt Disney Concert Hall in Los Angeles, which opened in 2003. In 2002 it spun its technology expertise into a separate company, Gehry Technologies, which developed Digital Project, an architecture and construction product built on the CATIA platform. Digital Project was used on a number of the most geometrically demanding projects of the following decade. In 2014 Gehry Technologies was acquired by Trimble.
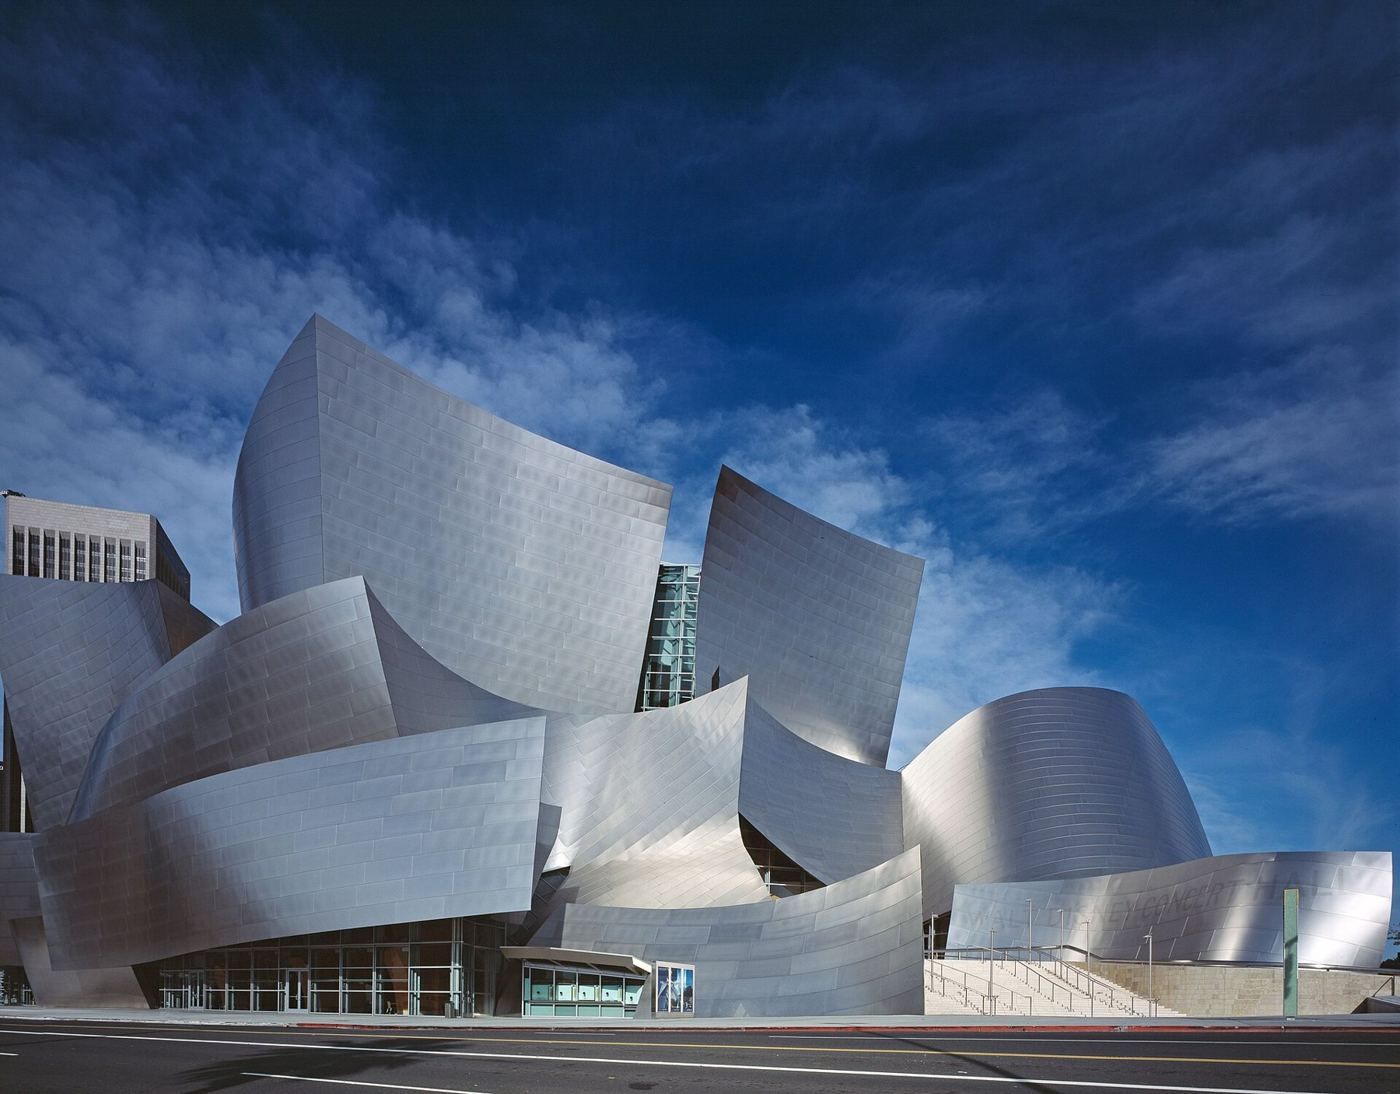
Carol M. Highsmith. Public domain, via Wikimedia Commons.
What architecture learned from aerospace
The Gehry story is sometimes treated as a curiosity: a famous architect with an unusual software habit. It was more important than that. It demonstrated three lessons that mainstream BIM would absorb over the next twenty years.
First, a model can be a contractual reference for fabrication, not merely a design aid. Second, digital pre-assembly, the ancestor of clash detection, saves more money than it costs when the geometry is difficult. Third, the construction supply chain, including steel fabricators, curtain wall specialists and precast manufacturers, is ready to work directly from models when someone gives them a reliable one.
Mechanical and aerospace modellers such as CATIA are excellent at precise geometry and manufacturing, but they were not built around building semantics such as spaces, storeys, systems and room data. That is why complex-geometry projects today often combine tools: a computational or surface modeller for form, a BIM authoring tool for documentation and information, and open standards to link them.
Chapter 7 · 1994–2024
Teaching Models to Talk
A model locked in one vendor's file solves one office's problem and creates everyone else's.
By the mid-1990s it was clear that the construction industry would never run on a single piece of software. An architect, a structural engineer, a mechanical designer, a steel fabricator, a cost consultant and a facility manager each needed specialised tools. If their models could not exchange information, the paper problem would simply reappear in digital form, with each discipline re-entering data from the others' drawings.
1994A consortium of twelve
In 1994 Autodesk convened a consortium of twelve US companies, including the telecoms firm AT&T, the HVAC manufacturer Carrier, the controls company Honeywell and the architecture practice HOK, to explore how software applications used in building could share data. The group gave its first public technology demonstration at the A/E/C SYSTEMS '95 trade show in Atlanta in June 1995, and in September 1995 opened membership to any interested organisation.
The members quickly concluded that a standard controlled by one vendor would never be trusted by the others. In 1996 the organisation was renamed the International Alliance for Interoperability, the IAI, and committed to non-proprietary standards. Competitors including Bentley and Nemetschek joined.
1996–97The Industry Foundation Classes
The IAI's central product was a data model called the Industry Foundation Classes, IFC. The first version was released in the mid-1990s. IFC did not come from nowhere. It borrowed heavily from STEP, the international standard for exchanging product data in manufacturing (ISO 10303, first published in 1994), including STEP's EXPRESS language for defining data schemas.
IFC defines, in a vendor-neutral way, what a wall, a slab, a space, a pipe segment or a storey is, what properties it can carry and how elements relate to one another. A wall exported to IFC from one application can be read by another as a wall, with its type, materials, properties and relationships, not just as a collection of triangles.
2005buildingSMART
In 2005 the IAI renamed itself buildingSMART, partly because members found the old name long and hard to explain. The organisation became the custodian of what is now called openBIM: IFC and a family of related standards and services, developed by volunteers from software companies, clients, consultants and universities through national chapters around the world.
From schema to international standard
IFC matured through several major versions. IFC2x3, released in 2006, became the long-lived workhorse of the industry and is still encountered on many projects. IFC4 followed in 2013, and in the same year IFC became an international standard, ISO 16739. That institutional step mattered as much as any technical improvement: from 2013 a client could require open exchange of building data in a contract by citing an ISO standard.
The next great extension was infrastructure. IFC 4.3 added the entities needed to describe roads, railways, bridges, ports and waterways, including alignments along which such assets are laid out. It was published as ISO 16739-1:2024, turning IFC from a buildings standard into a standard for the built environment as a whole.
The supporting cast
Exchanging models turned out to be only part of the problem. Teams also needed to exchange issues about models without sending the model itself. Development of the BIM Collaboration Format, BCF, began in 2009, initiated by the software companies Solibri and Tekla; a BCF topic carries a title, status, assignee, comments and a camera viewpoint that points at specific elements.
Clients needed to state what information they required in a form software could check. The Information Delivery Specification, IDS, an XML standard for machine-readable information requirements, was approved by buildingSMART as version 1.0 in 2024. And everyone needed shared definitions of properties and classifications, which the buildingSMART Data Dictionary, bSDD, provides as a public online service.
IFC was not alone. CIS/2, a standard for exchanging structural steel models, was approved by the American Institute of Steel Construction in 2000. gbXML was developed for exchanging building geometry with energy analysis tools. COBie, described in Chapter 9, focused on handover data for facility managers.
Chapter 8 · 1997–2007
Revise Instantly
A small start-up in Massachusetts built a modeller around one promise: change anything, anywhere, and everything else follows.
The event most people associate with BIM going mainstream is the rise of Revit. The story begins, as Chapter 3 described, with parametric mechanical engineering.
1997Charles River Software
On 31 October 1997 Leonid Raiz and Irwin Jungreis, who had both worked as developers on PTC's Pro/ENGINEER, founded Charles River Software in Newton, Massachusetts. Their goal was to apply the parametric modelling that had transformed mechanical CAD to the building industry. Unlike mechanical parts, buildings are made of a vast number of elements with constant relationships between them: walls hosted on levels, doors hosted in walls, dimensions tied to grids, schedules tied to everything. The founders designed their software so that a change anywhere would propagate everywhere, in every view, in every sheet and every schedule.
In January 2000 the company renamed itself Revit Technology Corporation. The product name was a contraction of revise instantly, which described the pitch precisely.
2000Revit 1.0
Revit 1.0 was released on 5 April 2000, and new versions followed rapidly over the next two years. It was not the first building modeller, as the previous chapters make clear, but it arrived at the right time. Personal computers had become powerful enough to handle large parametric models, and a generation of architects fluent in 2D CAD was ready for something better.
2002Autodesk buys the future
In 2002 Autodesk, the dominant supplier of 2D drafting software, acquired Revit Technology Corporation for US$133 million. It was a striking decision: Autodesk's own AutoCAD business had helped entrench the 2D drafting workflows that Revit was designed to replace. In the same year Autodesk published its white paper Building Information Modeling, and, as Chapter 5 described, Laiserin's campaign helped the industry settle on that term.
From that point BIM stopped being a research programme and became a product category, with everything that implies: large investment, fast improvement, aggressive marketing, and claims that often outran what the software could actually do on a real project.
The disciplines arrive
Revit began as an architectural tool. Revit Structure was introduced in 2005 and Revit MEP in 2006, when the original product was renamed Revit Architecture. In 2013 the three were unified again into a single Revit product. The progression mirrored the industry's realisation that BIM only pays off fully when every discipline models in a coordinated way.
Other disciplines had their own pioneers. The Finnish company Tekla released the structural modeller Xsteel in 1993, which became Tekla Structures and one of the leading tools for steel and concrete detailing. Trimble acquired Tekla in 2011. Bentley Systems built a broad portfolio for buildings and, above all, infrastructure on its MicroStation platform.
2000sThe clash detection era
If modelling was the promise of BIM, coordination was where it first paid for itself on ordinary projects. A software product originally called JetStream, developed in Sheffield in the United Kingdom, became Navisworks: a tool that could combine large models from many sources into one federated view, navigate it smoothly on an ordinary computer and detect where elements collided. Autodesk acquired Navisworks for US$25 million on 1 June 2007.
At the same time Solibri, founded in Finland in 1999, developed rule-based model checking, which looked not only for physical clashes but for missing information, incorrect classifications and breaches of design rules. It was acquired by the Nemetschek Group in 2015.
Clash detection transformed the coordination meeting. Instead of overlaying drawings on a light table, teams walked through a federated model and assigned hundreds of issues before anything reached site. For many contractors this, rather than design authoring, was the first unarguable return on investment in BIM.
On large coordination programmes the software is rarely the constraint. The constraint is whether every discipline's model follows the same levels, grids, units, origins and naming. A clash report built on inconsistent models produces thousands of false issues. The discipline of setting those rules first, now written into ISO 19650, was learned the hard way during this decade.
Chapter 9 · Part III · The institutions · 2003–2013
The Owners Take Notice
Vendors can make software. Only clients can make an industry change the way it works.
By the early 2000s BIM had a name, a market, open standards in development and a growing list of impressive projects. It still had a problem. The people who paid for most construction, the building owners, had little reason to demand it. Designers bore the cost of modelling. Contractors and owners enjoyed much of the benefit. Until someone at the top of that chain asked for models, adoption would remain uneven.
The first large owners to ask were public bodies that own and operate enormous estates for decades, and who therefore feel the cost of bad information more than anyone.
2003The US General Services Administration
The US General Services Administration, which builds and manages federal buildings across the United States, launched its National 3D-4D-BIM Program in 2003. Its Public Buildings Service began requiring BIM for spatial program validation on major new projects from fiscal year 2007, so that the space requirements a client set could be checked directly against the design model rather than by counting rooms on drawings. The GSA published a series of BIM guides covering subjects such as spatial validation, laser scanning, energy performance and circulation, which were widely read far beyond federal projects.
2007The Nordic clients
Around the same time several Nordic public clients began requiring models, and in particular open IFC models. In Finland the state property agency Senate Properties introduced BIM requirements for its projects in 2007. Danish state clients moved in a similar direction in the same period, and Norway's public construction agency Statsbygg became a prominent advocate of IFC. These clients cared less about which software their consultants used and more about receiving information they could keep, check and reuse. Their insistence on open formats did a great deal to make IFC a practical reality.
2007COBie and the handover problem
One of the most expensive failures of the paper era happened at the very end of a project. At handover, owners received boxes, and later discs, of drawings, manuals and spreadsheets from which their facilities teams had to re-type asset information into maintenance systems. Much of it was never captured at all.
In 2007 Bill East, a researcher at the US Army Corps of Engineers' Construction Engineering Research Laboratory, created COBie, the Construction Operations Building information exchange. COBie replaced the paper handover with structured data about spaces, equipment types, components, systems, documents and warranties, delivered progressively during the project. Its genius was modesty: COBie can be delivered as an ordinary spreadsheet as well as through IFC, so a facilities manager with no BIM software can still use it. COBie was approved as part of the US National BIM Standard in December 2011, and in the UK its code of practice was published as BS 1192-4 in 2014.
2007A national standard for the United States
The first part of the National BIM Standard – United States, NBIMS-US, was published in 2007 through the National Institute of Building Sciences. Rather than prescribing software, it gathered consensus practices, reference standards and information exchanges into a single framework. It has been revised several times since; Version 4 was unveiled in 2023.
1988A research centre for integrated practice
Much of the academic groundwork was laid at Stanford University's Center for Integrated Facility Engineering, CIFE, founded in 1988 with Paul Teicholz, a construction information technology pioneer, as its first executive director. CIFE brought researchers and industry members together around what it called virtual design and construction, and trained a stream of doctoral students who carried four-dimensional, schedule-linked building models into practice.
2008The textbook
In 2008 Charles Eastman, Paul Teicholz, Rafael Sacks and Kathleen Liston published the BIM Handbook: A Guide to Building Information Modeling for Owners, Managers, Designers, Engineers and Contractors. It gave the field a shared reference, organised by the roles of the people involved rather than by software, and it trained a generation of students and professionals. Its subtitle is itself a small history lesson: by 2008 BIM had become something every party to a project had to understand.
2004–2013How developed is "developed"?
As models were exchanged between parties, a new kind of dispute emerged. If an architect sends a model to a contractor, how far can the contractor rely on it? Is a duct in the model a real routing decision or a placeholder? The answer the industry developed was the Level of Development, LOD.
The idea grew out of work at Vico Software in the mid-2000s on describing model progression. The American Institute of Architects formalised levels from LOD 100 to LOD 500 in its E202 document in 2008, and from 2013 the BIMForum in the United States published an element-by-element LOD Specification that interprets those levels for each building system. In Europe and in ISO 19650 the concept later evolved into the Level of Information Need, which asks not "how detailed is this element?" but "what geometry, data and documentation is needed, for which purpose, at which milestone?" That approach became an international standard as ISO 7817-1 in 2024.
Historic American Buildings Survey, HABS IL-1105, Library of Congress. Public domain.
2006Early adopters in Asia
Public housing and building authorities in Asia were also early movers. The Hong Kong Housing Authority introduced BIM in 2006 to improve the design of its very large programme of public housing. Singapore's Building and Construction Authority began building the policy framework that would, in the following decade, make it one of the first places in the world to require BIM for regulatory submissions.
Chapter 10 · 2008–2025
When Governments Started Asking
Adoption curves in construction bend when someone with a very large budget insists.
If one country turned BIM from a good idea into a condition of doing business, it was the United Kingdom. The British approach was notable not for inventing new technology but for treating BIM as an instrument of public policy, with a clear target date, a public description of what compliance meant and a set of freely available standards to go with it.
2008The wedge
In 2008 Mark Bew and Mervyn Richards drew a simple diagram that became one of the most reproduced images in the history of BIM. The BIM maturity model, often called the Bew–Richards wedge, described a progression from Level 0, unmanaged CAD drawings exchanged on paper, through Level 1, managed CAD with some 3D and shared file structures, to Level 2, collaborative working in which each discipline produces its own model and exchanges information in a common format and environment, and finally Level 3, a fully integrated and interoperable model shared by all parties.
2011The mandate
In May 2011 the UK government's Chief Construction Adviser, Paul Morrell, called for BIM to be adopted on public projects. In June 2011 the government published its Construction Strategy, which required fully collaborative 3D BIM, meaning Level 2, on centrally procured public projects by 2016. A BIM Task Group was established to help government departments and their supply chains get there.
The strategy's timing was deliberate. It gave the industry five years' notice, enough to invest and train, with a date that concentrated minds. And because the requirement was defined by process rather than by software, it did not favour any vendor.
2013–2015The PAS 1192 series
To say what Level 2 actually meant, the UK published a series of freely available specifications. PAS 1192-2:2013 defined how information should be specified, produced and managed during the delivery of a project: employer's information requirements, BIM execution plans, delivery plans and a common data environment with defined states. PAS 1192-3:2014 extended the approach to the operational phase and the asset information model. BS 1192-4:2014 codified COBie. PAS 1192-5:2015 became the first specification to address security in BIM, asking owners of sensitive assets to consider what their models revealed.
These documents shifted the conversation decisively. BIM was no longer described by software features but by responsibilities: who requires what information, when, in what structure, and who checks it.
2014–2023The world follows
Public procurement rules in Europe opened the door for others. The European Union's public procurement directive of 2014 allowed member states to require electronic tools such as building information modelling on public works. An EU BIM Task Group of public-sector representatives published a handbook for introducing BIM in the European public sector in 2017.
National programmes multiplied, each shaped by local conditions:
| 2013–15 | Singapore · BIM e-submission phased in for architectural plans from 2013, engineering plans from 2014 and all new projects over 5,000 m² from 2015. Its successor system, CORENET X, followed in the 2020s. |
| 2014–15 | Dubai · Dubai Municipality Circular 196 (2014) required BIM for large and complex buildings; Circular 207 (2015) widened the scope. |
| 2014 | France · The Plan Transition Numérique dans le Bâtiment was announced in December 2014, focusing on experimentation, training and adoption by smaller firms. |
| 2015 | Germany · The federal transport ministry's Stufenplan (December 2015) set a path to BIM on new federal transport infrastructure from the end of 2020. |
| 2018 | Italy · A government decree phased in BIM requirements for public works, reaching full scope by 2025. |
| 2018 | Hong Kong · BIM required on government capital works projects above HK$30 million from 1 January 2018. |
| 2018 | Saudi Arabia · Requirements arrived through client standards rather than a single national mandate, beginning with BIM standards from the Royal Commission for Riyadh City and later the giga-projects. |
| 2019 | Mexico · The Ministry of Finance published a national strategy for implementing BIM (Modelado de Información de la Construcción) on federal investment projects in March 2019, with a phased eight-year roadmap. |
| 2023 | Japan · BIM announced as a requirement for public works from fiscal year 2023. |
The United States took a different path. There is no single federal mandate; instead, large owners such as the GSA, the US Army Corps of Engineers, state transport departments and major universities set their own requirements, supported by NBIMS-US.
2018ISO 19650: BIM grows up
The UK approach was then internationalised. In 2018 the first two parts of ISO 19650 were published, with national adoptions such as BS EN ISO 19650 following into early 2019. Part 1 sets out concepts and principles; Part 2 describes the delivery phase of assets. The series continued with Part 3 on the operational phase and Part 5 on security in 2020, Part 4 on information exchange in 2022, and Part 6 on health and safety information in 2025. The UK consolidated its guidance into the UK BIM Framework, and the Level 2 language gradually gave way to the vocabulary of ISO 19650.
ISO 19650 is the point at which BIM stops being about software at all. It is an information management standard: organisational, asset, project and exchange information requirements; appointments and responsibility matrices; delivery plans; the common data environment and its approval states; and naming, metadata and security. It does not mention which modelling tool anyone should use.
Chapter 11 · 2011–2026
Models the Size of Cities
At a certain scale, drawings cannot hold a project together. The information itself has to be engineered.
The 2010s were the decade of the megaproject model. Airports, rail networks, hospitals, stadiums and entire urban districts were delivered by teams that could number in the thousands, spread across countries and time zones. On such programmes BIM stopped being an optional productivity tool. It became the only practical way to keep hundreds of design packages, fabricators and contractors working from the same version of the truth.
This is also the part of the story in which ConstruBIM's own teams took part. We have tried to report our projects the way we report everyone else's: with what was done, what was measured and what it taught, rather than with adjectives.
2011The Soumaya Museum, Mexico City
The Soumaya Museum in Mexico City is one of the city's most recognisable buildings: an asymmetric, curving volume wrapped in a shimmering skin of hexagonal panels. It is a direct descendant of the Gehry lesson in Chapter 6. A form like this cannot be clad from drawings alone; every panel is a different shape in a different position.
The museum, designed by the architect Fernando Romero, also closes a loop with Chapter 6: Gehry Technologies was retained to coordinate the complex three-dimensional engineering using its Digital Project software, and the facade contractor used laser surveys of the built structure to adapt the model to the real shape of the frame, an early example of reality capture feeding the model on site.
ConstruBIM's work on the project involved BIM-driven fabrication coordination for the facade, from concept geometry through to installation, for 14,808 unique hexagonal panels, alongside a federated architectural, structural and MEP model. The model was not an illustration of the facade. It was the facade's manufacturing and installation reference.

Gadi-kab. CC0, via Wikimedia Commons.
2015–2016NAICM, the new Mexico City International Airport
The new Mexico City International Airport, known by its Spanish acronym NAICM, was one of the most ambitious aviation programmes of its era, with a terminal of around 743,000 m² whose flowing roof structure required architecture, structure and building systems to be resolved together rather than in sequence.
ConstruBIM's approach was a single federated BIM model that unified the work of dozens of disciplines. At the time it was the largest federated BIM model in the world. Around the model the team ran a common data environment with controlled workflows for how information was created, checked, approved and shared, the same governance principles that ISO 19650 would formalise internationally two years later.
Three details from the project record show how far BIM had travelled from the drafting office:
A model as a database. The structural model alone held some 26 million structural nodes in a single database. Drawings as a by-product. More than 10,500 drawings for the construction-document set were generated automatically from the model, which is Charles Eastman's 1975 argument delivered at airport scale. Clashes prioritised by data. A custom clash-detection clustering tool grouped thousands of clashes by spatial concentration, so that teams resolved the densest conflicts first instead of working through an undifferentiated list.
In 2015 ConstruBIM also established a dedicated BIM command centre on the construction site, putting the model at the centre of daily site decisions rather than behind office doors; the company describes it as the first of its kind. In 2016 the programme received an Autodesk AEC Excellence Award.
History did not treat the airport kindly. Following the change of government in 2018, the project was cancelled before completion. But the delivery system it proved, a federated model governed by a common data environment and used on site every day, did not disappear. It became the template for how large programmes are run.

Command centres, war rooms and federated truth
The megaproject years changed the physical workplace of BIM. Coordination moved from meeting rooms with printed markups to rooms built around large screens, where federated models were navigated live with designers, contractors and clients present. Issues were assigned in software, tracked to closure and reported as data. Across the world, rail programmes, hospitals and airports adopted variations of the same pattern.
2020sGiga-projects and the governance turn
In the Gulf, a new generation of giga-projects pushed the scale further still, often to the size of cities. On such programmes the challenge was no longer only coordinating models but governing information across hundreds of appointed parties, each with their own software, standards and contracts.
ConstruBIM has led digital delivery at NEOM in Saudi Arabia, where the work centres on governance: BIM execution plans, information requirements and common data environment workflows at a scale few teams ever face. On Guggenheim Abu Dhabi, the challenge is the older one of complex geometry and high coordination demand across many stakeholders. And on projects of every size, from the HGA Hospital in Acapulco, where the BIM model served as the primary source of information for coordination and execution, to the GAIA Residences in Limassol, a five-building complex of 150 apartments delivered with coordinated BIM and shop drawings, the same frame of work applies.
1. Federation beats merger. Keep each discipline's model owned by its author and combine them for coordination; do not try to force everyone into one file.
2. Agree the rules before the first element. Coordinates, levels, naming, units and classification decide whether a clash report means anything.
3. Put the model where decisions happen. A model that only lives in the design office is a drawing with extra steps.
4. Measure information, not geometry. The questions that matter are whether the right data is present, checked and approved on time.
Chapter 12 · Part IV · The living model · 2007–2026
Code, Cloud and the Open Web of Data
The model left the file. It became a database, a script, a shared platform and, finally, a set of open services.
For most of its history a building model lived in a file on somebody's computer. In the years after 2007 three forces pulled it out of that file: designers who wanted to program their models, cloud platforms that let everyone work on one shared set of information, and open standards that let data move between services on the web.
2007Visual programming for designers
In 2007 David Rutten, working at Robert McNeel & Associates, released a plug-in for the Rhino modeller originally called Explicit History. Renamed Grasshopper, it let designers build algorithms by connecting components on a canvas instead of writing code. A generation of architects used it to explore forms that responded to rules, sunlight, structure or fabrication limits. Sutherland's constraints of 1963 had become a visual programming language.
The BIM authoring world followed. Dynamo, begun by Ian Keough as an open-source visual programming project for Revit, appeared in beta form around 2011 and was adopted and developed by Autodesk. It absorbed ideas from DesignScript, the design language Robert Aish had led at Autodesk, and became the everyday automation tool of many BIM teams: renumbering rooms, placing thousands of elements, checking data, and exporting information that the standard user interface could not reach. Scripting frameworks such as pyRevit and links such as Rhino.Inside.Revit, which runs Rhino and Grasshopper inside Revit, blurred the line between computational design and documentation.
2010sThe model moves to the cloud
The second force was the cloud. Through the 2010s project teams moved from shared network drives and emailed files to web platforms that hosted models, drawings, issues and approvals in one governed place. Autodesk's BIM 360 services, its acquisition of the construction software company PlanGrid in 2018 and the Autodesk Construction Cloud assembled from 2020 were one path; in 2026 those construction products are part of Autodesk's Forma family. Bentley's ProjectWise, Trimble Connect, Procore, Oracle Aconex, Dalux, Catenda and many others offered their own. Collaborative model editing in the cloud, which Graphisoft's Teamwork had anticipated decades earlier, became routine.
These platforms are the practical implementation of the common data environment described in ISO 19650. Their value is not storage. It is control: knowing which version of which model was approved, by whom, for what purpose, and who is working on what right now.
2020–2023Early design becomes computational
Generative and analytical tools reached the earliest stages of design. Autodesk acquired the Norwegian company Spacemaker in 2020, and its technology became the basis of Autodesk Forma, launched in 2023, which lets planners and architects test site layouts against sunlight, wind, noise and density before a building model exists. Other tools such as TestFit and Hypar automated feasibility studies. The idea that design options could be generated and evaluated by software, rather than drawn one at a time, moved from research into practice.
2022–2026Models as services
The third force was the open web. Autodesk renamed its developer platform Forge as Autodesk Platform Services in 2022, exposing model data through web APIs. Open-source projects such as Speckle, which grew out of academic research, and IfcOpenShell with its Blender-based authoring tool Bonsai, made it possible to stream, query and edit building data without a single dominant desktop program. That Open Company (formerly IFC.js) and xeokit brought IFC models directly into web browsers.
At the same time the open standards described in Chapter 7 matured into a connected system: IFC 4.3 extended to infrastructure as ISO 16739-1:2024; IDS 1.0 made information requirements machine-checkable in 2024; and the buildingSMART Data Dictionary gave properties and classifications stable web addresses. A client can now write a requirement once, as an IDS file referencing bSDD definitions, and have every delivered IFC model checked against it automatically.
In the file era, the question was "which file is the latest?" In the service era, the question becomes "which fact is authoritative?" That shift, from managing documents to managing data, is still under way in 2026 and explains much of what the next chapter describes.
Chapter 13 · 2002–2026
From Model to Twin
A building's model used to be finished when the building was. Now the building's life is where the model begins to earn its keep.
For most of BIM's history the model served design and construction, and then, at handover, it was archived. Yet the operating phase of a building lasts decades and accounts for most of its lifetime cost. The last chapter of the story, still being written, is about keeping the model alive after the contractor leaves.
2000s–2020sCapturing reality
A living model needs to know what was actually built, not only what was designed. Terrestrial laser scanners, which measure millions of points per second, moved from specialist surveying into building projects through the 2000s. The resulting point clouds let teams verify existing conditions, check construction against the design and create as-built models, a workflow now known as scan-to-BIM. The vendor-neutral E57 format, published as an ASTM standard in 2011, allowed point clouds to move between tools. Photogrammetry from drones and phones, mobile mapping systems and 360-degree cameras then made capture faster and cheaper, so that some sites are now recorded every week.
2002The idea of a twin
The term digital twin did not come from construction. The concept is usually traced to Michael Grieves, who presented the idea of a virtual representation linked to a physical product during work on product lifecycle management at the University of Michigan around 2002. NASA used the term in its technology roadmaps around 2010 for spacecraft. The built environment adopted it in the late 2010s.
In the United Kingdom the Centre for Digital Built Britain published the Gemini Principles in December 2018, setting out values for a national digital twin: that twins should have a clear public purpose, be trustworthy and function through open, secure data. ISO 19650-3, published in 2020, defined how the asset information model is maintained during operation.
2018–2026Twin platforms
Software for operational twins arrived around the turn of the 2020s. Bentley Systems introduced its iTwin platform in 2018. Autodesk launched Tandem in the early 2020s, aimed at turning handover data into an operational twin. Established facilities and asset management systems such as IBM Maximo, Archibus and Planon added BIM and IFC integration, while smart-building platforms connected models to building management systems and Internet of Things sensors. In practice most twins in 2026 are modest and useful: a trustworthy register of assets and spaces, linked to live data for a few critical systems. That is a good start, and far more than the boxes of paper that COBie was created to replace.
2020sThe arrival of artificial intelligence
The newest force acting on BIM is artificial intelligence, and it is too early to write its history with confidence. Several strands are visible in 2026. Computer vision compares 360-degree site imagery with the model to measure progress automatically. Machine learning helps classify elements, clean point clouds and cluster clashes. Generative tools produce layout options and render concept images from models.
Most recently, conversational assistants have begun to appear inside authoring tools themselves. Autodesk introduced an AI assistant as a technical preview in Revit 2027, and Trimble previewed a model assistant for Tekla Structures in its 2026 releases. These assistants can answer questions about a model, automate routine edits and connect to other systems through open protocols.
Construction robotics is advancing in parallel: layout robots that print floor plans directly onto slabs from the model, drilling robots guided by BIM coordinates, and legged robots carrying scanners through sites on a schedule. Augmented reality headsets, which once promised to overlay models on every site, have had a more uneven path; Microsoft stopped manufacturing its HoloLens 2 at the end of 2024, even as tablet- and phone-based AR continues to be used.
Every generation of BIM technology has been sold with promises that ran ahead of practice. AI will be no different. An assistant can only be as reliable as the information it reads. The organisations that benefit first will be the ones whose models are already structured, classified and governed, which is to say, the ones that took ISO 19650 seriously.
Epilogue · Epilogue
What Sixty Years Teach
The geometry was never the hard part.
Look back across the whole story and a pattern appears that is easy to miss when you are inside it. Almost every important idea in BIM arrived long before the industry was ready to use it. Constraints and instances in 1963. The integrated building database in 1975. Object-based modelling on commercial projects in the late 1970s. The phrase Building Information Model in 1992. Open exchange in the mid-1990s. Each waited years, sometimes decades, for hardware, incentives and institutions to catch up.
That pattern teaches five lessons that matter on any project today.
1. The modelling problem was solved long ago. The information problem was not.
Every generation of software has been better at geometry than the last. The recurring failure has stayed the same: nobody defined what the model was for, so it was built to no particular standard and served no particular decision. That is the gap ISO 19650 addresses, and it is why good information requirements usually pay back faster than more modelling capacity.
2. Adoption follows whoever pays.
Research did not spread BIM, and neither did marketing. Clients did: the GSA, the Nordic state agencies, the UK government, Singapore, Dubai, the giga-projects. If you want better information on your projects, write it into the appointment.
3. Open standards outlive products.
RUCAPS, Sonata and Reflex are gone. Products are renamed, acquired and retired every year, and even in 2026 several of the names in this book changed. IFC, BCF, COBie and ISO 19650 persist because nobody owns them. Information that must survive a building's lifetime should live in open formats.
4. Be suspicious of confident claims.
If the widely repeated story of who coined the term BIM can be wrong twice in one sentence and still circulate freely, treat confident claims about BIM maturity, levels and return on investment with the same care. Ask for the source.
5. A model is only as alive as the people who maintain it.
The title of this book is a promise and a warning. A model can carry a building's information from its first sketch to its final refurbishment, but only if someone owns it, checks it and keeps it true. Software makes that possible. It does not make it happen.
This book is the story. The ConstruBIM Academy is the practice: a free, categorised database of more than 200 BIM and 3D modelling tools, 800+ answered questions, learning paths and certification in four levels, in English, Spanish, French and Arabic.
construbim.com/bim-academy · construbim.com/bim-certification
Appendix A
Timeline of BIM, 1962–2026
Key dates referred to in this book. Dates of software releases and standards are the earliest documented dates in the sources listed in Appendix C.
| 1957 | Patrick Hanratty's PRONTO numerical-control programming system, an ancestor of CAD/CAM. |
| 1962 | Douglas Engelbart's Augmenting Human Intellect describes an architect designing at a computer. |
| 1963 | Ivan Sutherland's Sketchpad at MIT: light pen, geometric constraints, master and instance. |
| 1967 | Charles Eastman joins Carnegie Mellon University. |
| 1970s | RUCAPS developed by John Davison and John Watts; GLIDE solid-modelling research at Carnegie Mellon. |
| 1975 | Eastman publishes The Use of Computers Instead of Drawings in Building Design, describing the Building Description System. |
| 1977 | RUCAPS sold commercially through GMW Computers. CATIA begins at Avions Marcel Dassault. |
| 1982 | Graphisoft founded in Budapest by Gábor Bojár. AutoCAD launched. |
| 1984 | Bentley Systems founded. Graphisoft begins work on Apple computers. |
| 1985–86 | "Building model" used by Simon Ruffle and Robert Aish. Sonata succeeds RUCAPS in the mid-to-late 1980s. |
| 1987 | ArchiCAD released: 2D and 3D from one model on a personal computer. |
| 1992 | Van Nederveen and Tolman print "Building Information Model". Gehry's Barcelona Fish realised with CATIA. |
| 1993 | Tekla releases Xsteel, later Tekla Structures. |
| 1994 | Autodesk-led consortium of twelve US companies begins work on interoperability. STEP (ISO 10303) first published. |
| 1996 | Consortium renamed International Alliance for Interoperability; first IFC release. PTC acquires Reflex. |
| 1997 | Charles River Software (later Revit Technology Corporation) founded. Guggenheim Museum Bilbao opens. |
| 1999 | Solibri founded in Finland. |
| 2000 | Revit 1.0 released (5 April). CIS/2 approved by AISC. |
| 2002 | Autodesk acquires Revit (US$133m) and publishes Building Information Modeling. Gehry Technologies founded. Grieves' digital twin concept. |
| 2003 | Laiserin convenes Autodesk, Bentley and Graphisoft around the term BIM. GSA National 3D-4D-BIM Program. Walt Disney Concert Hall opens. |
| 2005 | IAI renamed buildingSMART. Revit Structure introduced. |
| 2006 | IFC2x3 released. Revit MEP introduced. Hong Kong Housing Authority introduces BIM. |
| 2007 | COBie created. NBIMS-US first published. Senate Properties (Finland) BIM requirements. GSA requires BIM for spatial validation. Autodesk acquires Navisworks; Nemetschek acquires Graphisoft. Grasshopper released. |
| 2008 | BIM Handbook published. AIA E202 defines LOD 100–500. Bew–Richards maturity diagram. |
| 2009 | BIM Collaboration Format (BCF) development begins. |
| 2011 | UK Government Construction Strategy requires Level 2 BIM by 2016. Soumaya Museum, Mexico City. Dynamo in beta. Trimble acquires Tekla. ASTM E57 point cloud standard. |
| 2013 | IFC4 and ISO 16739. PAS 1192-2. BIMForum LOD Specification. Revit disciplines unified. |
| 2014 | EU public procurement directive allows BIM requirements. Dubai Circular 196. BS 1192-4 (COBie). PAS 1192-3. Trimble acquires Gehry Technologies. |
| 2015 | Singapore BIM e-submission for all projects over 5,000 m². Germany's Stufenplan. PAS 1192-5. On-site BIM command centre at NAICM. Nemetschek acquires Solibri. |
| 2016 | UK Level 2 mandate takes effect. NAICM receives an Autodesk AEC Excellence Award. |
| 2017 | EU BIM Task Group handbook. |
| 2018 | ISO 19650-1 and -2. Gemini Principles. Hong Kong and Italy requirements. Bentley iTwin. Autodesk acquires PlanGrid. |
| 2019 | Mexico's national BIM strategy (MIC). UK BIM Framework. |
| 2020 | ISO 19650-3 and -5. Autodesk acquires Spacemaker. Charles Eastman dies. |
| 2022 | ISO 19650-4. Forge renamed Autodesk Platform Services. |
| 2023 | Japan requires BIM for public works. NBIMS-US V4. Autodesk Forma launched. |
| 2024 | IFC 4.3 as ISO 16739-1:2024. IDS 1.0. ISO 7817-1 (Level of Information Need). HoloLens 2 production ends. |
| 2025 | ISO 19650-6 (health and safety information). |
| 2026 | AI assistants previewed inside BIM authoring tools. Autodesk construction products organised under the Forma name. The Living Model published free by ConstruBIM. |
Appendix B
A Short Glossary
- BIM (Building Information Modelling / Modeling)
- Creating and using a structured digital description of a built asset, made of objects with properties and relationships, from which drawings, quantities and analyses are derived.
- Parametric modelling
- Modelling in which elements are defined by parameters and rules, so that a change propagates to related elements. Descends from Sketchpad's constraints.
- Federated model
- A combination of separately authored discipline models viewed together for coordination, without merging their ownership.
- Clash detection
- Automatic identification of conflicts between elements in a federated model: hard clashes (physical overlaps), soft clashes (clearance breaches) and workflow clashes.
- IFC (Industry Foundation Classes)
- The open, vendor-neutral data model for building and infrastructure information maintained by buildingSMART; ISO 16739-1:2024 (IFC 4.3).
- BCF (BIM Collaboration Format)
- An open format for exchanging coordination issues, with viewpoints and element references, without exchanging the model.
- IDS (Information Delivery Specification)
- A buildingSMART XML standard, version 1.0 in 2024, for writing information requirements that software can check automatically.
- bSDD (buildingSMART Data Dictionary)
- An online service publishing classifications and property definitions with stable identifiers.
- COBie
- Construction Operations Building information exchange: structured handover data about spaces, assets, systems and documents, deliverable as a spreadsheet or through IFC.
- LOD (Level of Development)
- A scale from LOD 100 to 500 describing how far other parties can rely on a model element at a given milestone.
- LOIN (Level of Information Need)
- The ISO approach (ISO 7817-1:2024) that specifies the geometry, data and documentation needed for a defined purpose and milestone.
- ISO 19650
- The international series of standards for managing information over the whole life cycle of a built asset using BIM.
- CDE (Common Data Environment)
- The agreed source of information for a project or asset, where information containers move through controlled states: work in progress, shared, published and archived.
- OIR, AIR, PIR, EIR
- Organisational, asset, project and exchange information requirements: the chain of "what information do we need, and why" defined in ISO 19650.
- BEP (BIM Execution Plan)
- The delivery team's plan for how it will meet the information requirements of an appointment.
- AIM and PIM
- Asset information model (used in operation) and project information model (produced during delivery).
- 4D and 5D BIM
- Linking model elements to construction schedules (4D) and to cost (5D).
- Point cloud and scan-to-BIM
- A 3D dataset captured by laser scanning or photogrammetry, and the process of turning it into an as-built model.
- Digital twin
- An information model of an asset kept connected to its real condition through captured and live data, and used to support decisions.
- openBIM
- The buildingSMART approach of collaborating through open standards and workflows rather than proprietary formats.
Appendix C
Sources and Further Reading
Dates and facts were checked against the following sources in September 2026. Encyclopedia articles are listed where they summarise primary sources; readers researching a specific claim should follow them to the original documents.
Foundational works
- Sutherland, I. E. (1963). Sketchpad: A Man-Machine Graphical Communication System. PhD thesis, Massachusetts Institute of Technology.
- Engelbart, D. C. (1962). Augmenting Human Intellect: A Conceptual Framework. Stanford Research Institute.
- Eastman, C. (1975). The Use of Computers Instead of Drawings in Building Design. AIA Journal.
- Van Nederveen, G. A., & Tolman, F. P. (1992). Modelling multiple views on buildings. Automation in Construction, 1(3).
- Eastman, C., Teicholz, P., Sacks, R., & Liston, K. (2008). BIM Handbook. Wiley.
- Laiserin, J. (2003–2004). Writings on the standardisation of the term BIM, The LaiserinLetter.
- Autodesk (2002). Building Information Modeling (white paper).
History, companies and products
- Building information modeling — en.wikipedia.org/wiki/Building_information_modeling
- Charles M. Eastman — en.wikipedia.org/wiki/Charles_M._Eastman
- Sketchpad — en.wikipedia.org/wiki/Sketchpad
- RUCAPS — en.wikipedia.org/wiki/RUCAPS
- Graphisoft — en.wikipedia.org/wiki/Graphisoft
- Autodesk Revit — en.wikipedia.org/wiki/Autodesk_Revit
- buildingSMART — en.wikipedia.org/wiki/BuildingSMART
- Navisworks — en.wikipedia.org/wiki/Navisworks
- Digital Project — en.wikipedia.org/wiki/Digital_Project
- Archinect, "How Frank Gehry helped create the era of technological construction" — archinect.com
- Nemetschek acquires Solibri (December 2015) — solibri.com; bimireland.ie
- Geometrica, "Museo Soumaya has a Secret" — geometrica.com; Architizer, Museo Soumaya by FR-EE — architizer.com
- Graphisoft history and the 1984 meeting with Steve Jobs — en.wikipedia.org/wiki/Graphisoft; Cult of Mac (2016) on the Graphisoft Park statue
- Priceonomics, "The Software Behind Frank Gehry's Geometrically Complex Architecture"; Archinect, "How Frank Gehry helped create the era of technological construction"
- Center for Integrated Facility Engineering, Stanford University — cife.stanford.edu
- ConstruBIM (2019). La Historia del BIM, lecture at UNAM, Mexico City (internal presentation).
- Historic American Buildings Survey. Frederick C. Robie House, 5757 Woodlawn Avenue, Chicago, Cook County, IL. HABS ILL-1005 (HABS Chicago Project, 1963). Library of Congress; Wikimedia Commons. Public domain.
- Historic American Buildings Survey. Edith Farnsworth House, 14520 River Road, Plano, Kendall County, IL. HABS IL-1105 (Farnsworth House Recording Project, 2009). Library of Congress; Wikimedia Commons. Public domain.
Standards and policy
- ISO 19650-1:2018 and ISO 19650-2:2018 — iso.org/standard/68078.html; iso.org/standard/68080.html
- ISO/TC 59/SC 13 catalogue (ISO 19650 parts 3–6, ISO 7817-1) — iso.org/committee/49180/x/catalogue
- IFC schema specifications (ISO 16739-1:2024) — technical.buildingsmart.org/standards/ifc
- BCF — technical.buildingsmart.org/standards/bcf · IDS — github.com/buildingSMART/IDS · bSDD — github.com/buildingSMART/bSDD
- National BIM Standard – United States — nibs.org/nbims
- BIMForum LOD Specification — bimforum.org
- PAS 1192-2:2013 — designingbuildings.co.uk
- EU BIM Task Group Handbook — eubim.eu/handbook
- Singapore CORENET X — info.corenet.gov.sg
- BIM Deutschland (Stufenplan) — bimdeutschland.de
- France, bâtiment numérique (PTNB) — ecologie.gouv.fr
- Mexico, Estrategia MIC (SHCP, 2019) — gob.mx
- Centre for Digital Built Britain (2018). The Gemini Principles.
- UK Cabinet Office (2011). Government Construction Strategy.
ConstruBIM project records
- NAICM Mexico City Airport case study — construbim.com/naicm
- ConstruBIM projects — construbim.com/projects
- ConstruBIM (2026). The story of BIM, from Sketchpad to ISO 19650 — construbim.com/blog-history-of-bim
Appendix D
Image Credits
Photographs of people, buildings and machines are reproduced from Wikimedia Commons under the licences stated, which remain in force for each image; they are not covered by this book's CC BY-NC-ND licence. Public-domain works may be reused freely. Measured drawings (Plates 1–7) are from the Historic American Buildings Survey and are in the public domain; Plate 1 carries annotations added by ConstruBIM. Diagrams are original to this book. Project images in Chapter 11 are from construbim.com.
- Figure 0.2. Historic American Buildings Survey Cervin Robinson, Photographer, 18 August 1963 EXTERIOR FROM SOUTH - Frederick C. Robie House, 5757 Woodla. Historic American Buildings Survey (Cervin Robinson, photographer). Public domain. https://commons.wikimedia.org/wiki/File:Historic_American_Buildings_Survey_Cervin_Robinson,_Photographer,_18_August_1963_EXTERIOR_FROM_SOUTH_-_Frederick_C._Robie_House,_5757_Woodlawn_Avenue,_Chicago,_Cook_County,_IL_HABS_ILL,16-CHIG,33-4.tif. Cropped by ConstruBIM.
- Chapter 1 portrait. SRI Douglas Engelbart 1968.jpg. SRI International. CC BY-SA 3.0 (https://creativecommons.org/licenses/by-sa/3.0). https://commons.wikimedia.org/wiki/File:SRI_Douglas_Engelbart_1968.jpg.
- Figure 1.2. SketchpadDissertation-Fig1-2.tif. Scanned by Kerry Rodden from original photograph by Ivan Sutherland. CC BY-SA 3.0 (https://creativecommons.org/licenses/by-sa/3.0). https://commons.wikimedia.org/wiki/File:SketchpadDissertation-Fig1-2.tif.
- Figure 1.3. Sketchpad N-Component Element.png. Sutherland, Ivan Edward. CC0 (http://creativecommons.org/publicdomain/zero/1.0/deed.en). https://commons.wikimedia.org/wiki/File:Sketchpad_N-Component_Element.png. Inverted by ConstruBIM.
- Chapter 1 portrait. Ivan Sutherland at CHM.jpg. Dick Lyon. CC BY-SA 3.0 (https://creativecommons.org/licenses/by-sa/3.0). https://commons.wikimedia.org/wiki/File:Ivan_Sutherland_at_CHM.jpg.
- Figure 2.2. Mies van der Rohe photo Farnsworth House Plano USA 1.jpg. Jack E. Boucher, photographer. Public domain. https://commons.wikimedia.org/wiki/File:Mies_van_der_Rohe_photo_Farnsworth_House_Plano_USA_1.jpg.
- Figure 4.2. Apple Lisa (3) in Computer History Museum - California.jpg. Marcin Wichary from San Francisco, Calif.. CC BY 2.0 (https://creativecommons.org/licenses/by/2.0). https://commons.wikimedia.org/wiki/File:Apple_Lisa_(3)_in_Computer_History_Museum_-_California.jpg.
- Figure 4.3. Unveiling the statue of Steve Jobs.JPG. Tamás Rell. CC BY-SA 3.0 (https://creativecommons.org/licenses/by-sa/3.0). https://commons.wikimedia.org/wiki/File:Unveiling_the_statue_of_Steve_Jobs.JPG.
- Figure 6.1. Boeing Boeing 777-200; N7771@GVA;09.09.1995 (6084007364).jpg. Aero Icarus from Zürich, Switzerland. CC BY-SA 2.0 (https://creativecommons.org/licenses/by-sa/2.0). https://commons.wikimedia.org/wiki/File:Boeing_Boeing_777-200;_N7771@GVA;09.09.1995_(6084007364).jpg.
- Chapter 6 portrait. Frank Gehry 2006 crop.jpg. Eric Richardson. CC BY 2.0 (https://creativecommons.org/licenses/by/2.0). https://commons.wikimedia.org/wiki/File:Frank_Gehry_2006_crop.jpg.
- Figure 6.2. Escultura de Frank O. Gehry con forma de peixe. Porto olímpico de Barcelona B18.jpg. Luis Miguel Bugallo Sánchez (Lmbuga). CC BY-SA 4.0 (https://creativecommons.org/licenses/by-sa/4.0). https://commons.wikimedia.org/wiki/File:Escultura_de_Frank_O._Gehry_con_forma_de_peixe._Porto_ol%C3%ADmpico_de_Barcelona_B18.jpg.
- Figure 6.3. Guggenheim Museum Bilbao 2.jpg. kallerna. CC BY-SA 4.0 (https://creativecommons.org/licenses/by-sa/4.0). https://commons.wikimedia.org/wiki/File:Guggenheim_Museum_Bilbao_2.jpg.
- Figure 6.5. Disney Concert Hall by Carol Highsmith.jpg. Carol M. Highsmith. Public domain. https://commons.wikimedia.org/wiki/File:Disney_Concert_Hall_by_Carol_Highsmith.jpg.
- Figure 11.1. Fachada Museo Soumaya 0.5.jpg. Gadi-kab. CC0 (http://creativecommons.org/publicdomain/zero/1.0/deed.en). https://commons.wikimedia.org/wiki/File:Fachada_Museo_Soumaya_0.5.jpg.
- Plates 1–3. Frederick C. Robie House, HABS ILL-1005, sheets 5, 7 and 12 of 14 (HABS Chicago Project, 1963). Public domain. Library of Congress; commons.wikimedia.org.
- Plates 4–7. Edith Farnsworth House, HABS IL-1105, sheets 3, 4, 5 and 8 of 8 (2009). Public domain. Library of Congress; commons.wikimedia.org.
Keep the book
Download the illustrated PDF to read offline, print or share. Free, no sign-up.
© 2026 ConstruBIM. Text and diagrams licensed CC BY-NC-ND 4.0. Photographs and historic drawings are credited individually; see Appendix D. Corrections: [email protected].